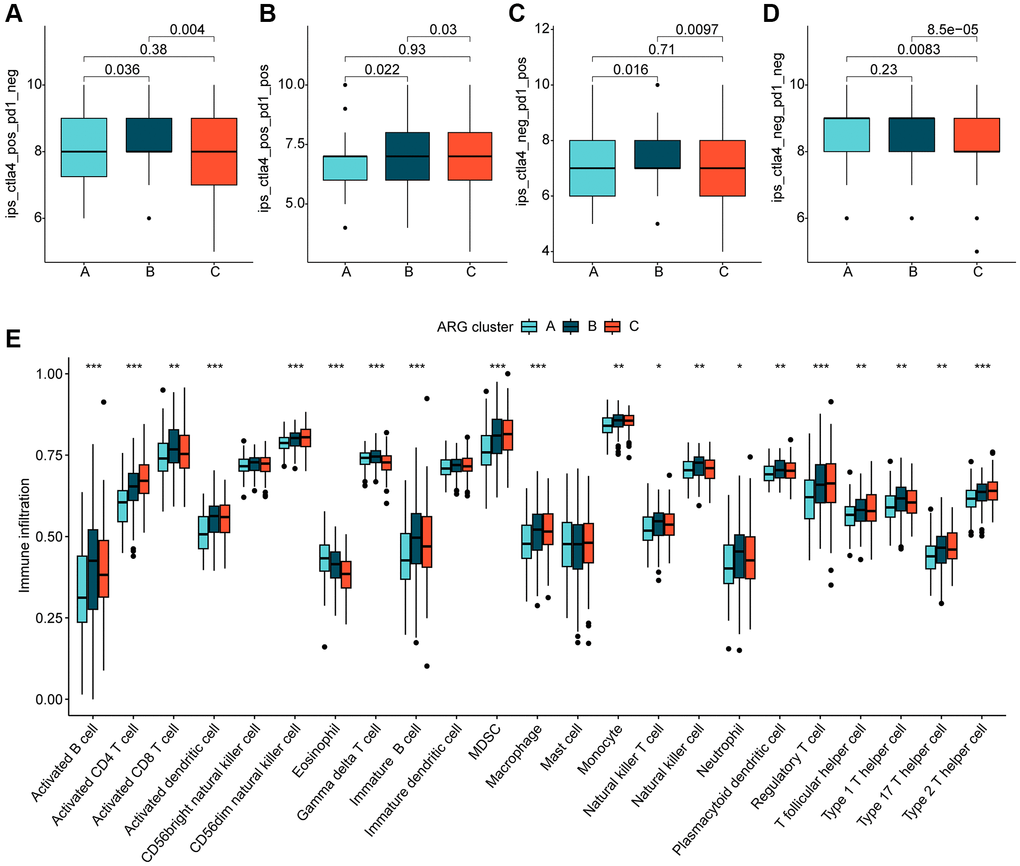
Figure 3.Immune infiltration of HCC molecular subtypes and immunotherapy assessment analysis. (A–D) IPS analysis reveals the therapeutic response of different HCC molecular subtypes to PD-1 and CTLA-4. (E) Immune infiltration landscape of HCC molecular subtypes assessed based on the ssGSEA algorithm. Statistical significance: *p < 0.05, **p < 0.01, ***p < 0.001.