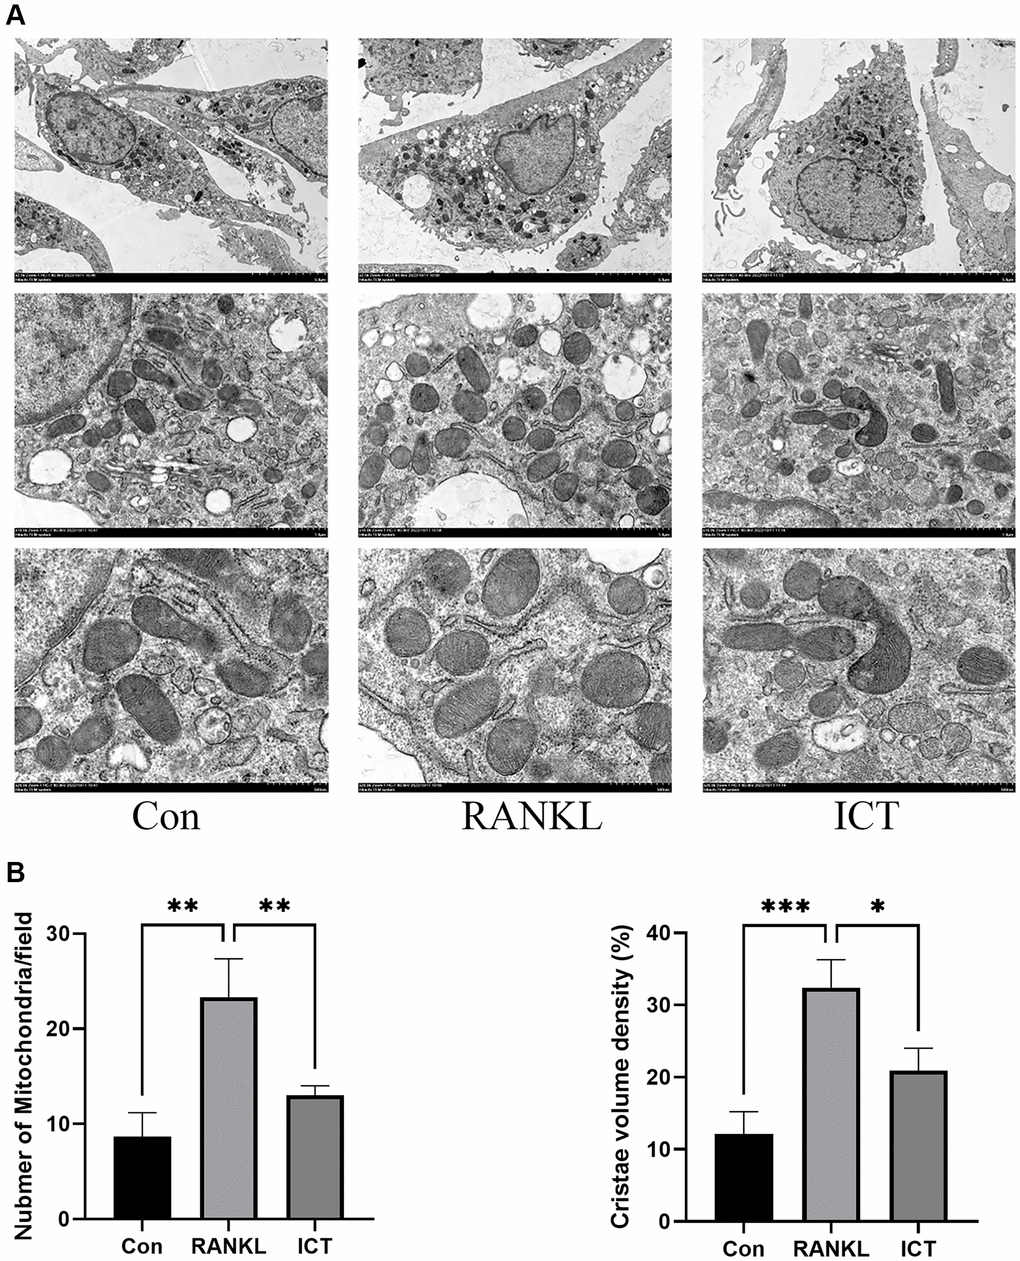
Figure 5.Representative images of ultrastructural analysis of mitochondria during osteoclast differentiation. (A) Representative image of mitochondria. (B) The quantitative analysis of mitochondria number and cristae density. All data were presented as mean ± SD, n = 3, *P < 0.05; **P < 0.01; ***P < 0.001.