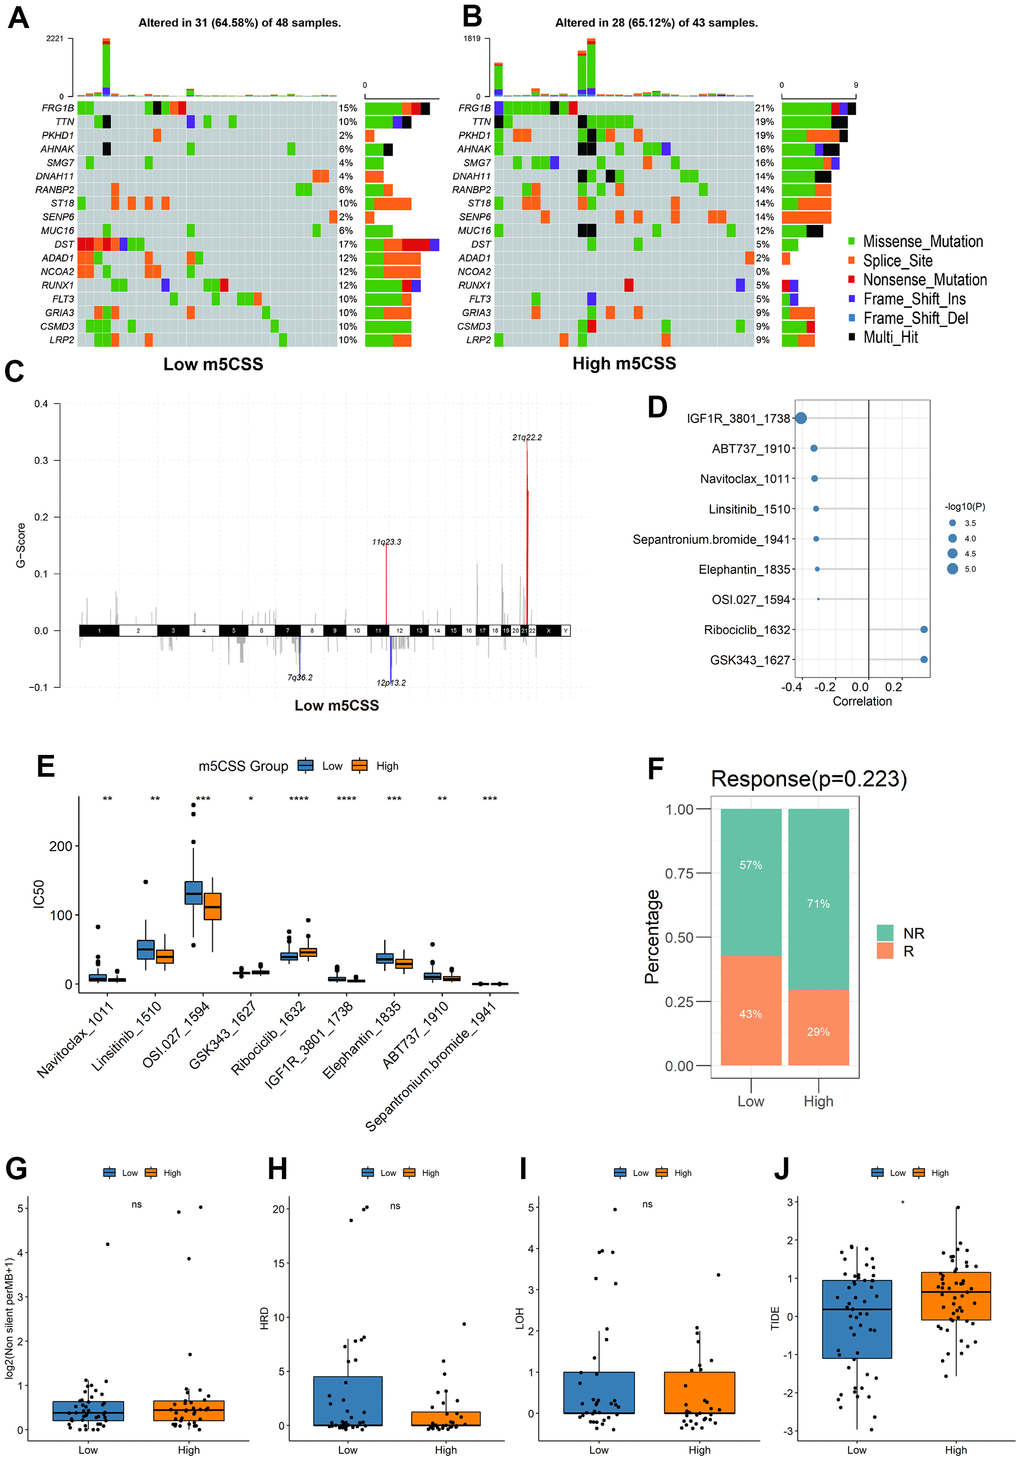
Figure 5.Distribution of m5C score in clinical characteristics samples and m5C subtypes. (A, B) Differences in mutations between high and low m5C score groups, (C) differences in copy number variants, (D) correlation between m5C score and drugs, (E) differences in drug resistance between high and low score groups, (F) proportion of patients responding to immunotherapy, differences in (G) TMB, (H) HRD, (I) LOH, (J) TIDE between high and low score groups.