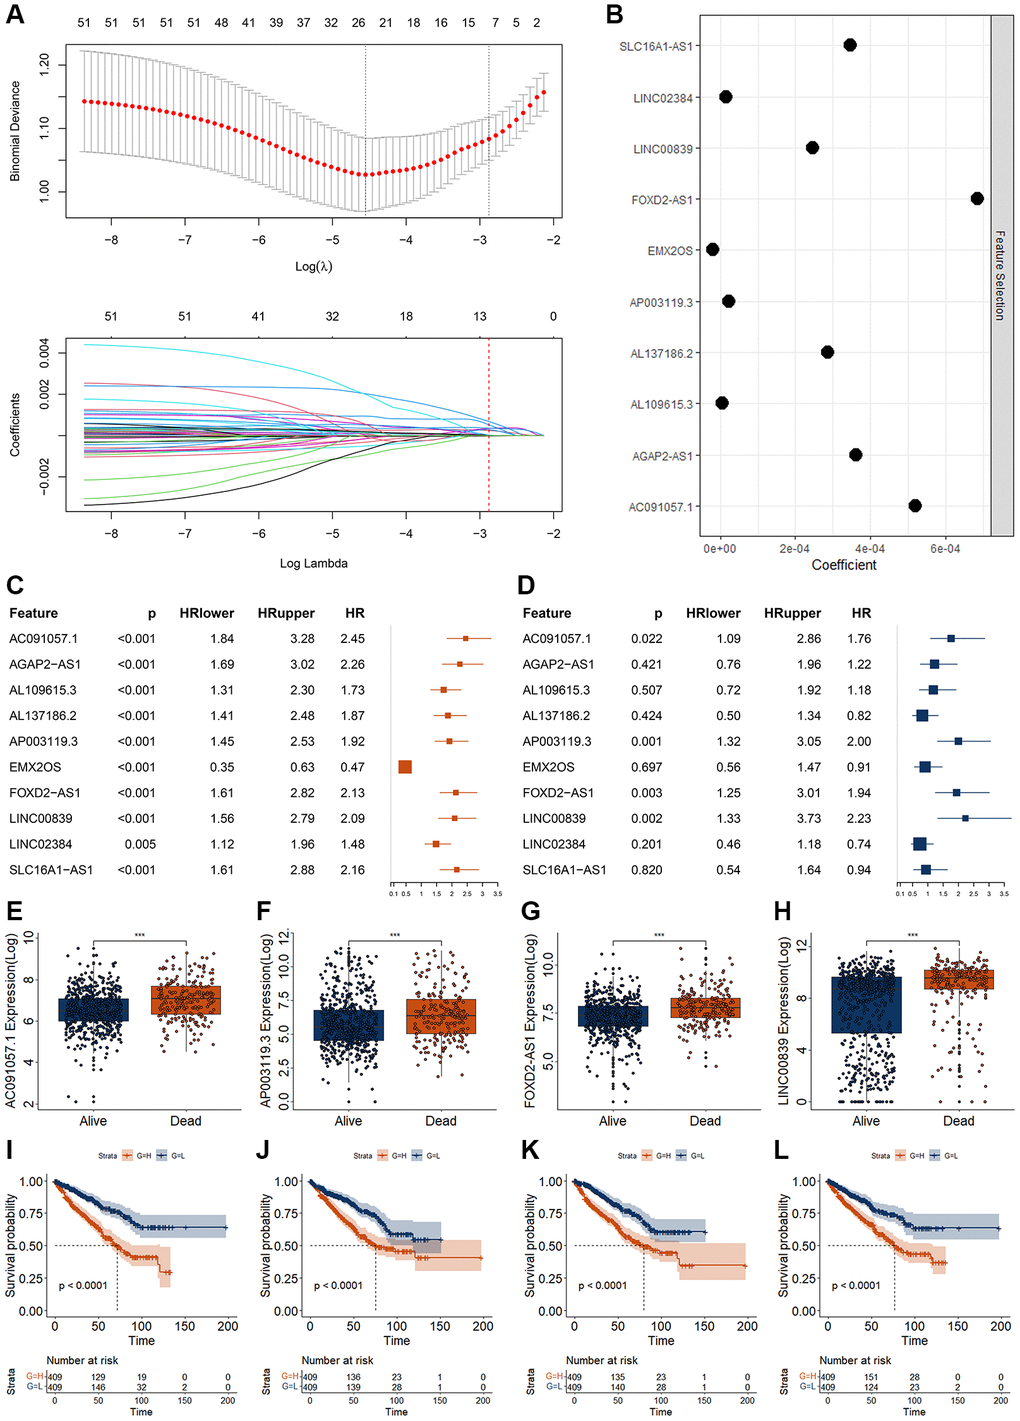
Figure 3.Screening of RCC biomarkers based on DECRLs. (A, B) Feature selection for 53 DECRLs using lasso algorithm. (C, D) Results of univariate (C) and multivariate (D) Cox regression for 10 DECRLs. (E–H) Expression of AC091057.1 (E), AP003119.3 (F), FOXD2-AS1 (G), LINC00839 (H) between alive and dead RCC patients. (I–L) K-M curve of AC091057.1 (I), AP003119.3 (J), FOXD2-AS1 (K), LINC00839 (L) in RCC patients. *p < 0.05. **p < 0.01. ***p < 0.001.