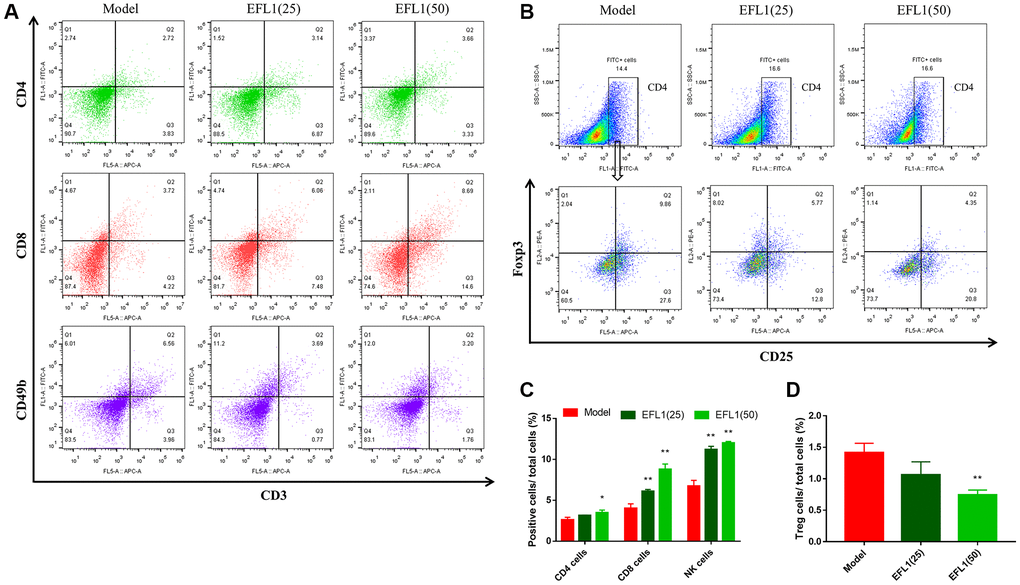
Figure 4.Measurements of T lymphocytes using flow cytometry. (A, B) Representative images of tumor-infiltrating CD4+, CD8+, NK1.1+ T cells and Tregs. (C, D) Statistical results of tumor-infiltrating CD4+, CD8+, CD49b+ T cells and Tregs. n = 3. Data were compared using one-way ANOVA with Dunnett’s post hoc. *P < 0.05, **P < 0.01 vs. Model.