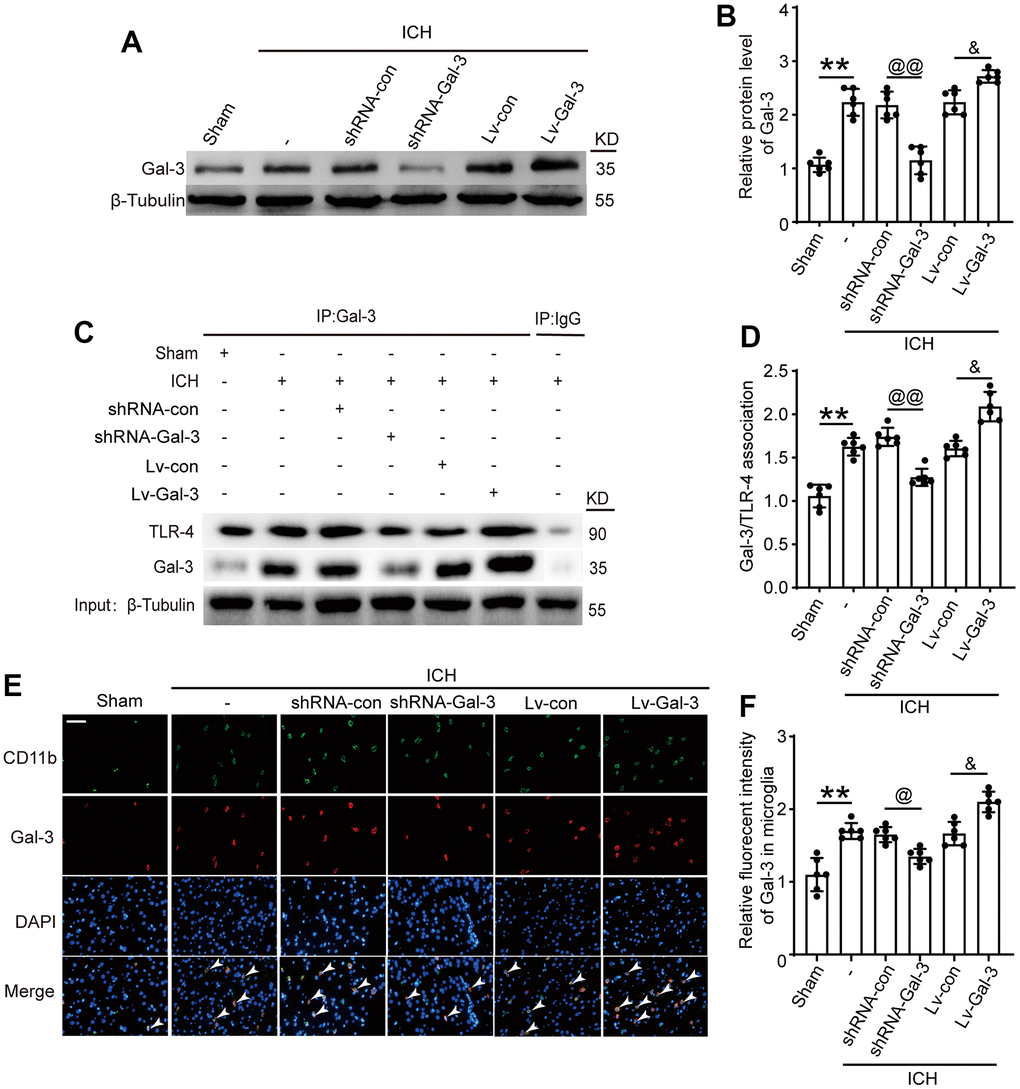
Figure 2.Intervention efficiency of overexpression and small interfering RNA lentivirus on Gal-3. (A, B) Western blot analysis and quantification of Gal-3 in intervention groups. (C, D) Gal-3/TLR-4 interactions in brain tissues after ICH and quantitative analysis was performed. (E, F) Double immunofluorescence analysis of Gal-3 (green) and microglia (red) in brain and the relative fluorescent intensity of Gal-3 in microglia, arrow indicated Gal-3 positive cells. Nuclei were labeled with DAPI (blue). Scale bar =50 μm. The black dots represent individual data in each group. **p < 0.01 and *p < 0.05 vs. Sham group, @@p < 0.01 and @p < 0.05 vs. ICH+shRNA-con group, &p < 0.05 vs. ICH+Lv-con group, n = 6.