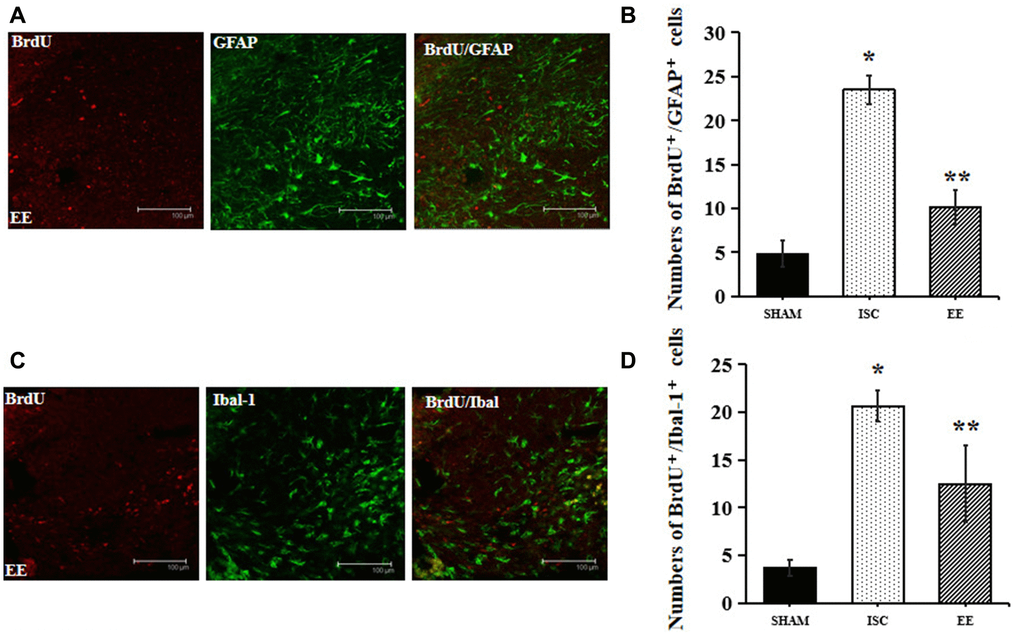
Figure 4.Differentiation of neuroblasts in the peri-infarct cortex. (A) Representative confocal images for BrdU+/GFAP+ cells in the peri-infarct cortex. Scale bar = 100 μm. (B) Quantification of BrdU+/GFAP+ cells in the peri-infarct cortex (n = 6). Statistical significance: *P < 0.01 vs. SHAM, **P < 0.01 vs. ISC. (C) Representative confocal images for BrdU+/Iba-1+ cells in the peri-infarct cortex. Scale bar = 100 μm. (D) Quantification of BrdU+/Iba-1+ cells in the peri-infarct cortex (n = 6). Statistical significance: *P < 0.01 vs. SHAM, **P < 0.01 vs. ISC.