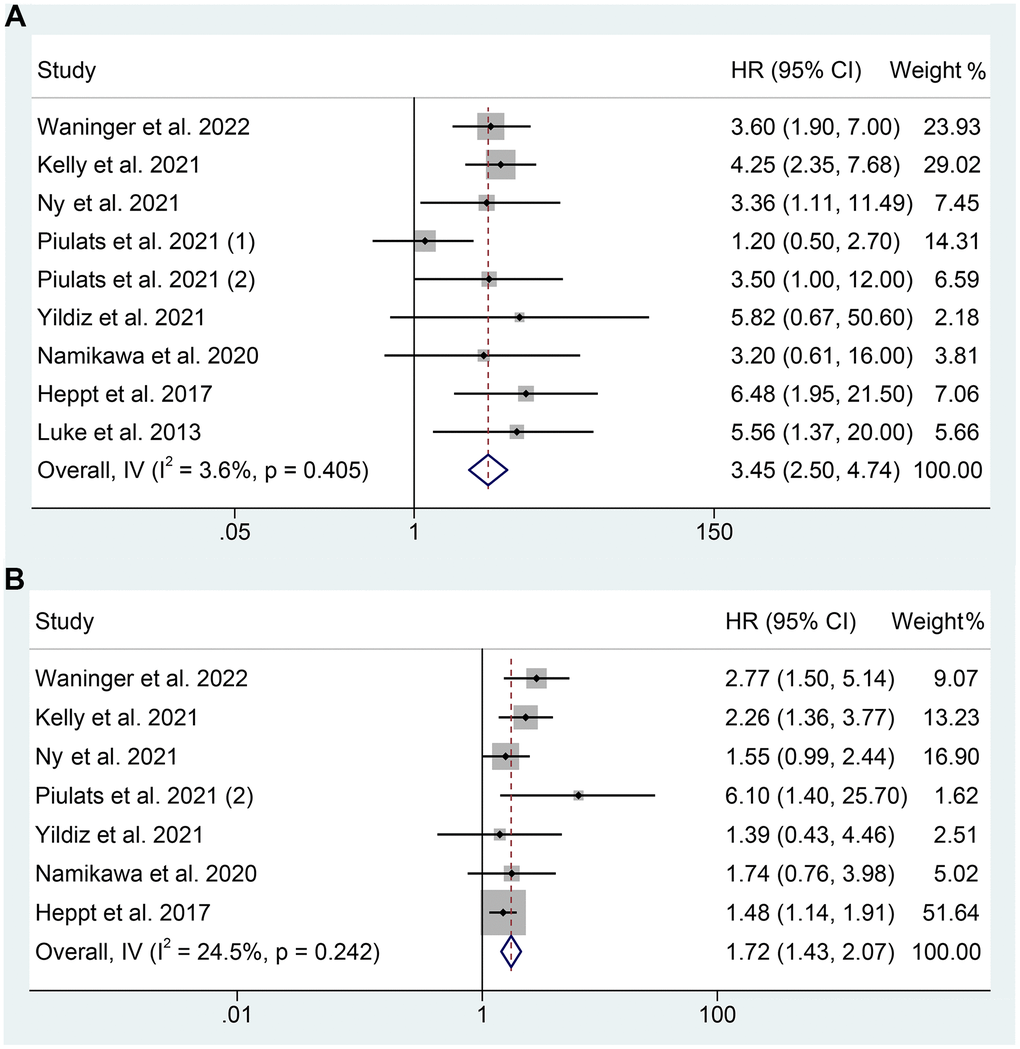
Figure 2.Forest plots of the relationship between baseline LDH levels and overall survival (A). Forest plots of the relationship between baseline LDH levels and progression-free survival (B). HR, hazard ratio; CL, confidence interval.
Figure 2 — Prognostic value of lactate dehydrogenase in patients with uveal melanoma treated with immune checkpoint inhibition | Aging