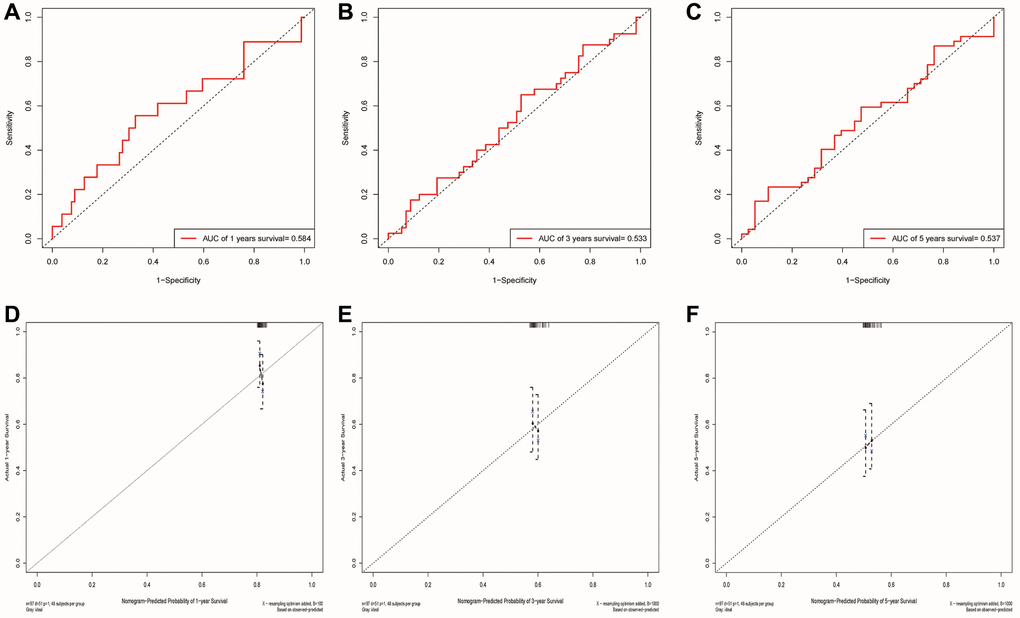
Figure 9.Validation of the risk model and the ability of the nomogram to predict prognosis using the GSE41613 cohort. (A–C) The ROC curve for predicting 1, 3 and 5-year survival rate based on the GSE41613 validation cohort, respectively. (D–F) Internal Calibration Curve of nomogram at 1-year, 3-year and 5-year based on the GSE41613 validation cohort, respectively.