Submit an Article
Navigate
Home
Editorial Board
Editorial Policies
Current Volume
Archive
Scientific Integrity
Publication Ethics Statements
Interviews with Outstanding Authors
Newsroom
Sponsored Conferences
Podcast
Contact
Special Collections
Submit an Article
Online ISSN: 1945-4589
Research Paper
|
Volume 15, Issue 19
|
pp. 10010–10030
Identification of an endoplasmic reticulum stress-related prognostic risk model with excellent prognostic and clinical value in oral squamous cell carcinoma
Back to article
Figure 5
(5 of 15)
−
100%
+
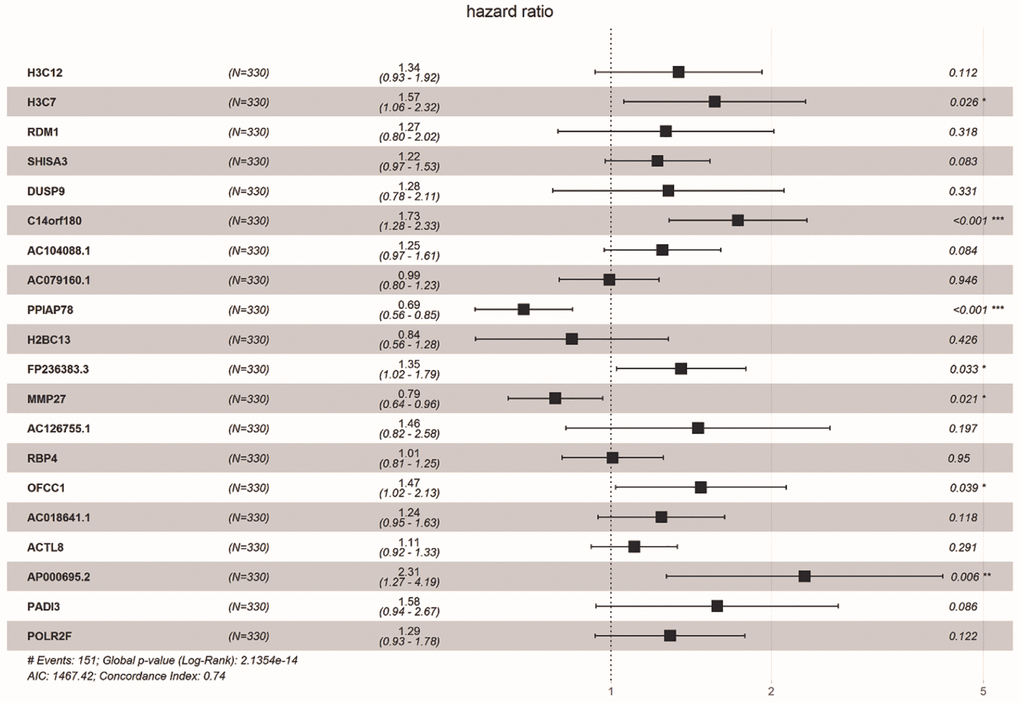
Figure 5.
Forest plot showing the top 20 prognosi- related DE-ERSs obtained by univariate regression analysis.
Protective genes and risk genes were located on the left and right sides of the vertical dotted line, respectively.