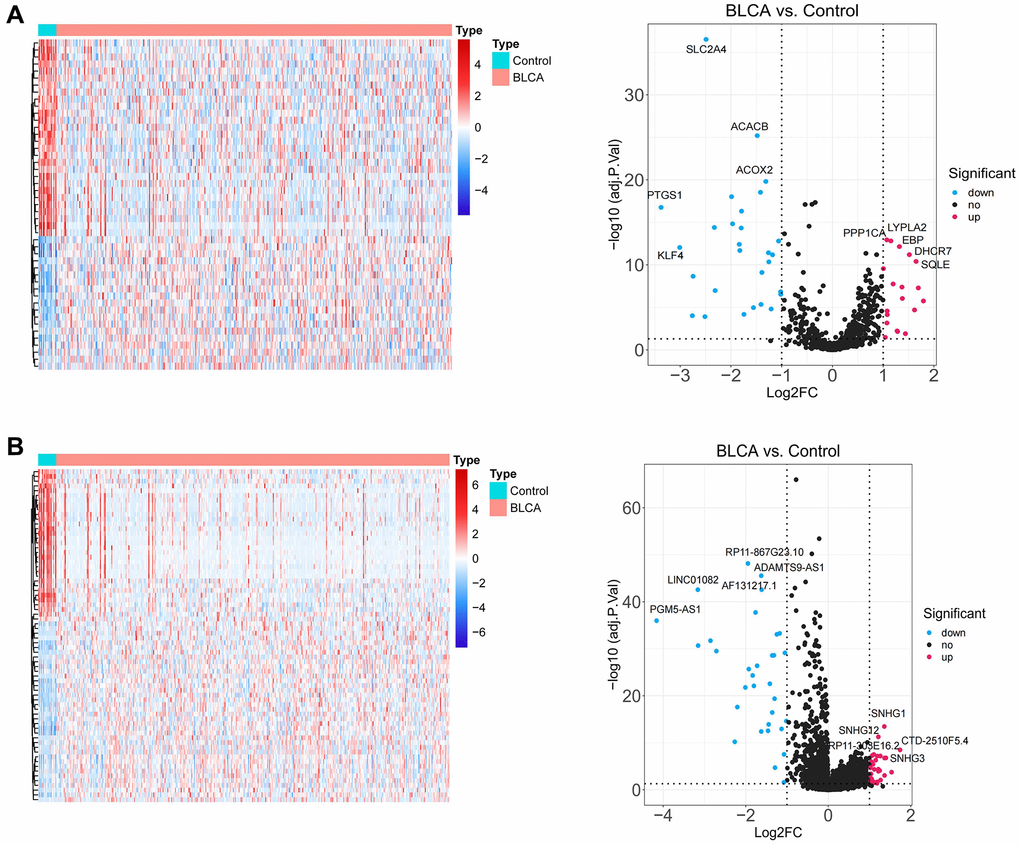
Figure 2.Identification of lipid metabolism-related DEGs. (A) The heatmap plot and volcano diagram show the differentially expressed LMRGs. (B) The heatmap plot and volcano diagram show the differentially expressed lncRNAs.
Figure 2 — Prognosis analysis and validation of lipid metabolism-associated lncRNAs and tumor immune microenvironment in bladder cancer | Aging