Submit an Article
Navigate
Home
Editorial Board
Editorial Policies
Current Volume
Archive
Scientific Integrity
Publication Ethics Statements
Interviews with Outstanding Authors
Newsroom
Sponsored Conferences
Podcast
Contact
Special Collections
Submit an Article
Online ISSN: 1945-4589
Research Paper
|
Volume 15, Issue 16
|
pp. 8325–8344
Construction and validation of cuproptosis-related lncRNA prediction signature for bladder cancer and immune infiltration analysis
Back to article
Figure 2
(2 of 12)
−
100%
+
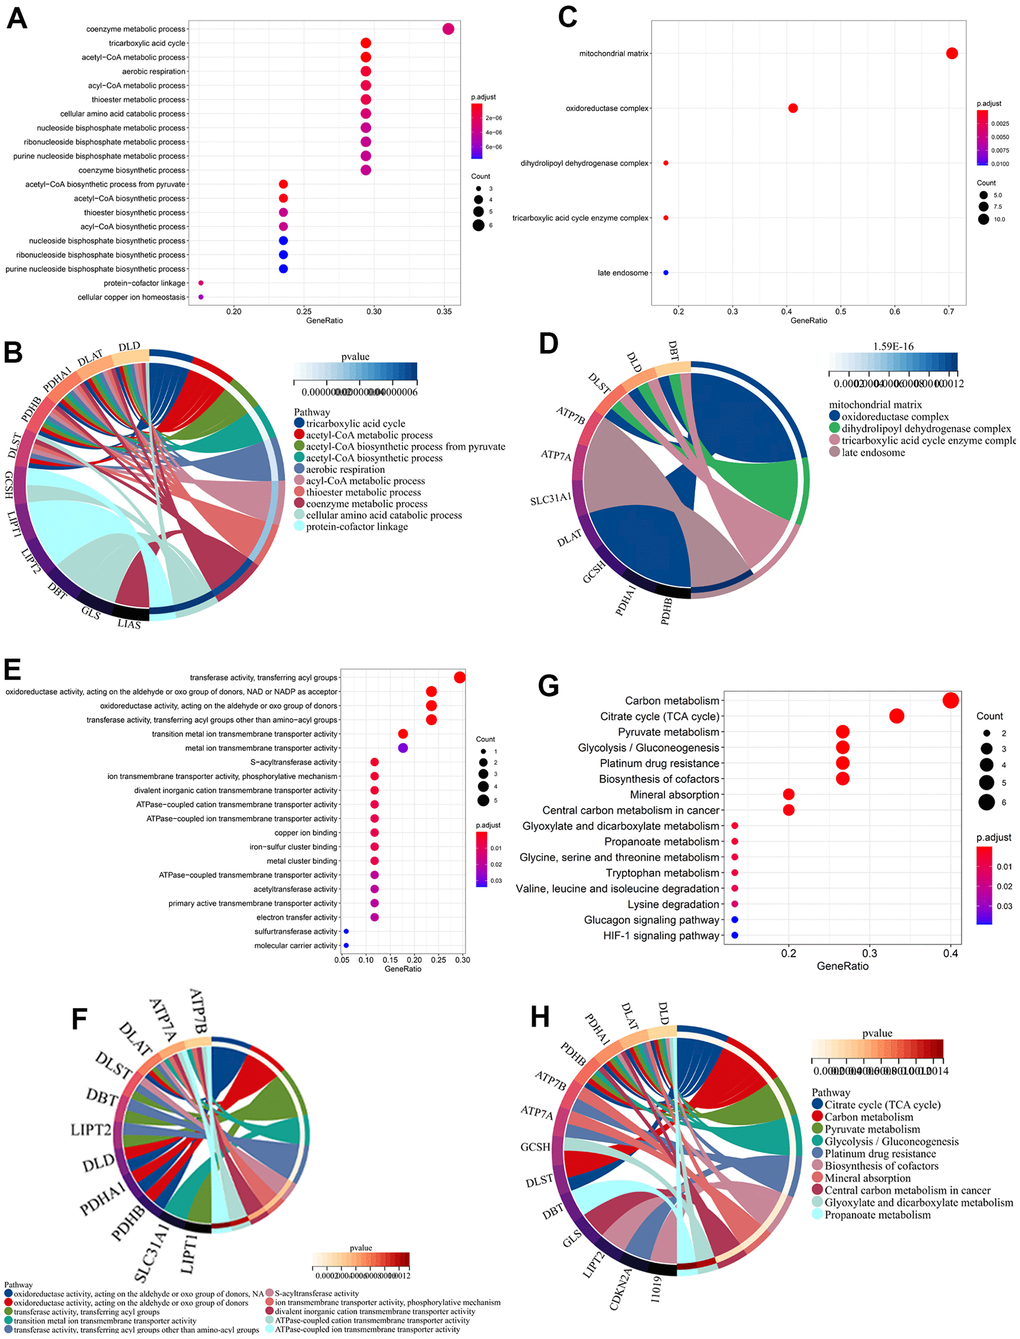
Figure 2.
Functional enrichment analysis of cuproptosis-related genes (CRGs) in BC.
The bar plot and circle plot of enriched GO BP (
A
,
B
), CC (
C
,
D
), MF (
E
,
F
), and KEGG (
G
,
H
) of CRGs in BC.