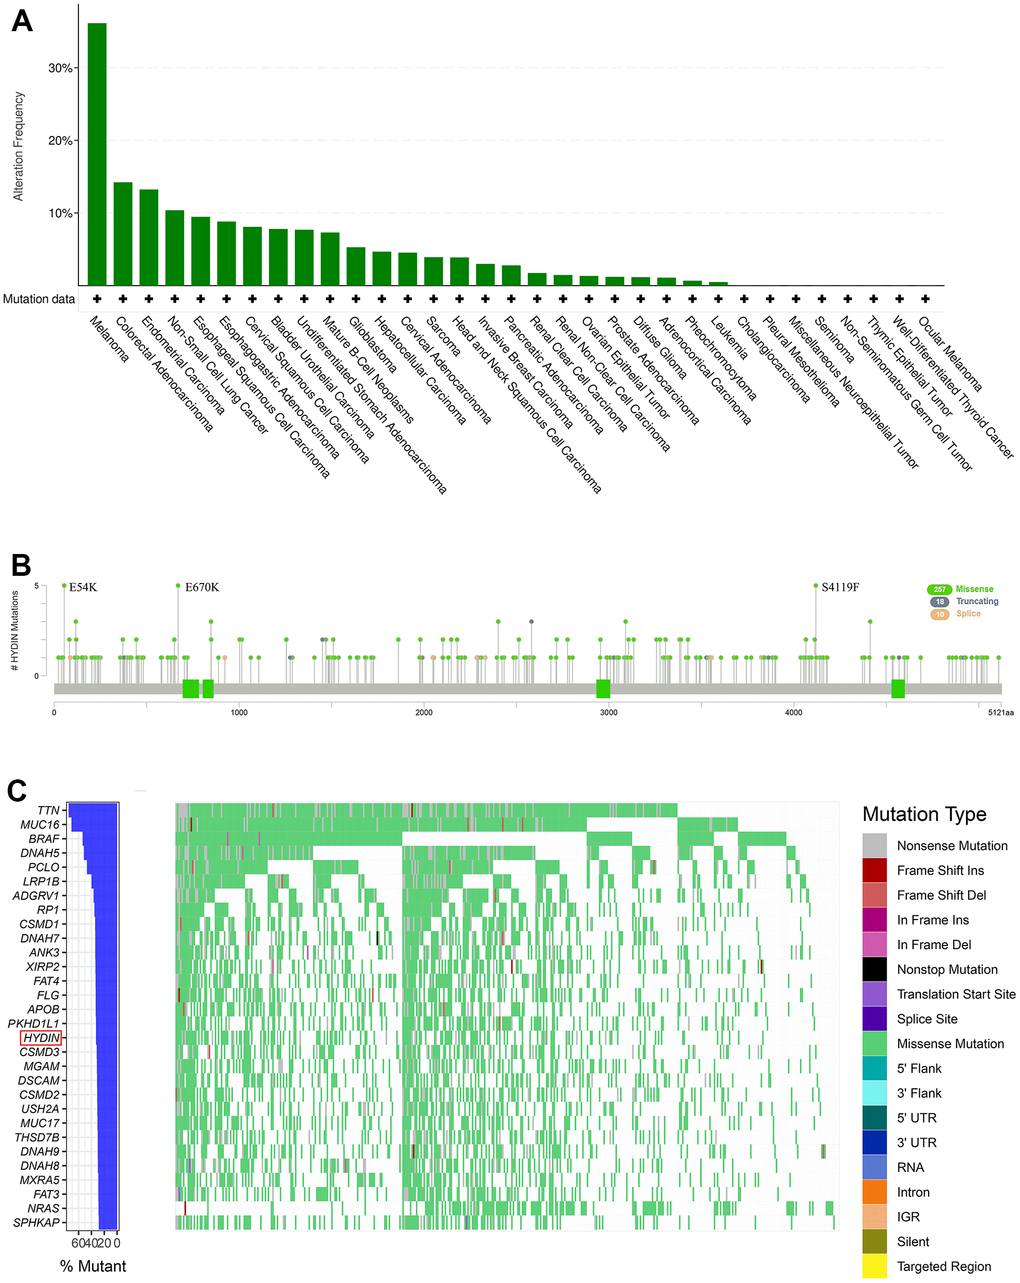
Figure 1.Mutation profile of HYDIN in melanoma. (A) Prevalence of HYDIN mutations across various cancers. (B) Mutation diagram of HYDIN in melanoma. (C) The gene mutation panoramas of the TCGA-SKCM cohort.
Figure 1 — HYDIN mutation status as a potential predictor of immune checkpoint inhibitor efficacy in melanoma | Aging