Submit an Article
Navigate
Home
Editorial Board
Editorial Policies
Current Volume
Archive
Scientific Integrity
Publication Ethics Statements
Interviews with Outstanding Authors
Newsroom
Sponsored Conferences
Podcast
Contact
Special Collections
Submit an Article
Online ISSN: 1945-4589
Research Paper
|
Volume 15, Issue 15
|
pp. 7551–7564
Metastasis-related long non-coding RNAs AL359220.1, SH3BP5-AS1 and ZF-AS1 are significant for prognostic assessment of lung adenocarcinoma
Back to article
Figure 5
(5 of 10)
−
100%
+
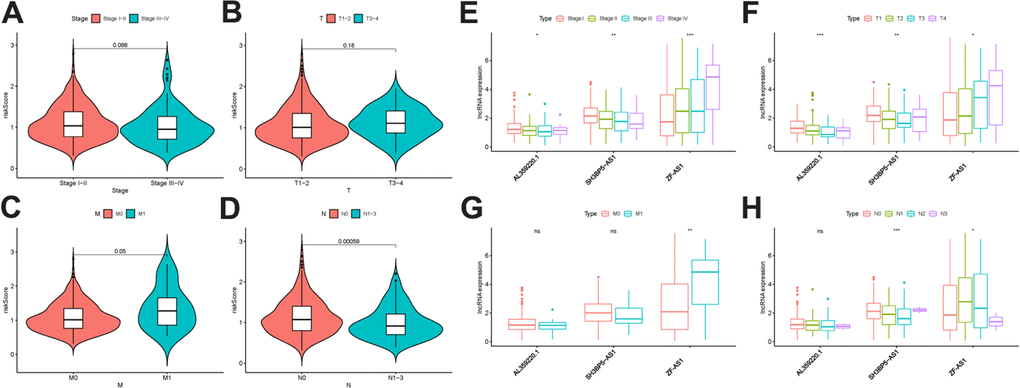
Figure 5.
The relationship between the risk score and clinical features.
Relationships between MRRS and stage (
A
), T- stage (
B
), M stage (
C
) and N- stage (
D
). Relationships between sMRLNRs and stage (
E
), T-stage (
F
), M-stage (
G
) and N-stage (
H
).