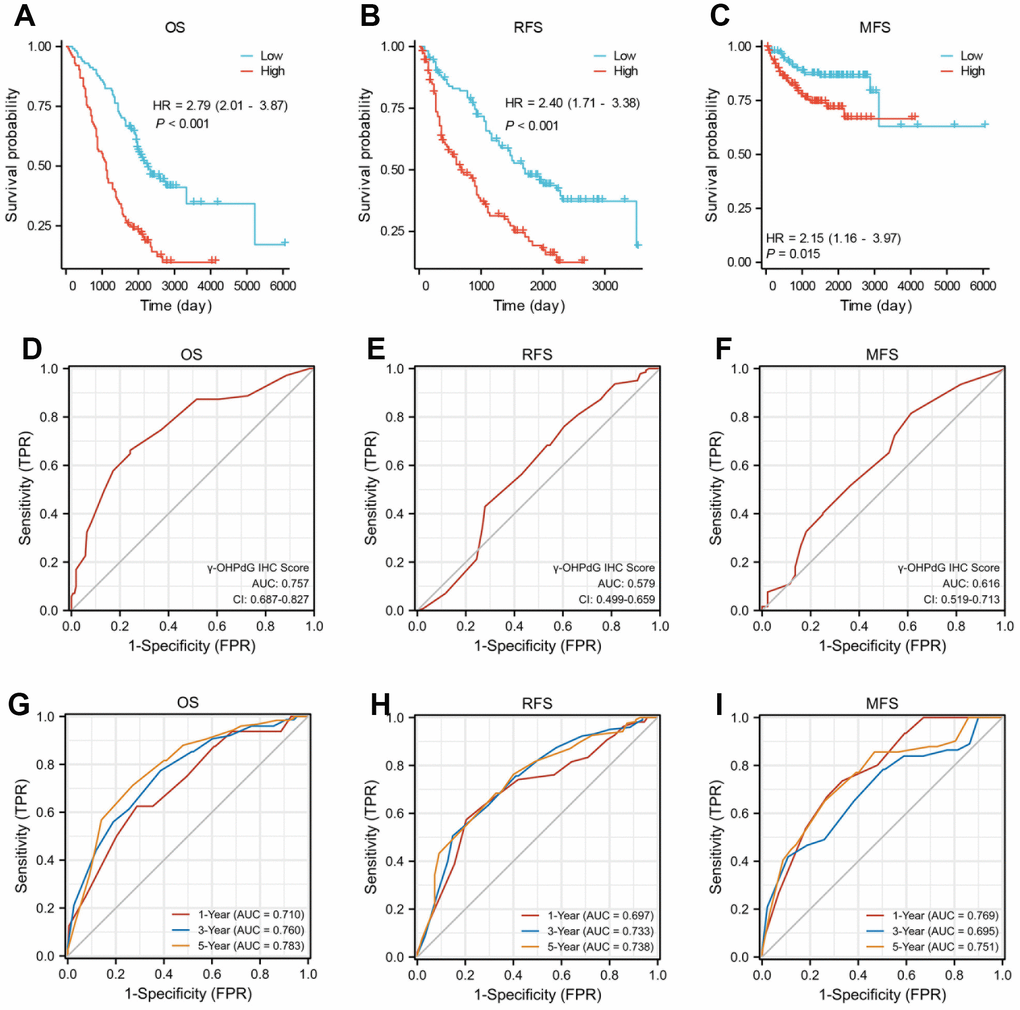
Figure 2.The γ-OHPdG levels and the prediction of prognosis in HCC patients. (A–C) Kaplan-Meier survival curve analysis of OS, PFS and MFS rates with high and low γ-OHPdG levels in HCC patients, respectively; (D–F) ROC curve validation of the prognostic value of the γ-OHPdG; (G–I) Time-dependent ROC curve analysis of the γ-OHPdG levels for OS, MFS and RFS.