Submit an Article
Navigate
Home
Editorial Board
Editorial Policies
Current Volume
Archive
Scientific Integrity
Publication Ethics Statements
Interviews with Outstanding Authors
Newsroom
Sponsored Conferences
Podcast
Contact
Special Collections
Submit an Article
Online ISSN: 1945-4589
Research Paper
|
Volume 15, Issue 14
|
pp. 7161–7186
Identification and validation of a novel overall survival prediction model for immune-related genes in bone metastases of prostate cancer
Back to article
Figure 5
(5 of 9)
−
100%
+
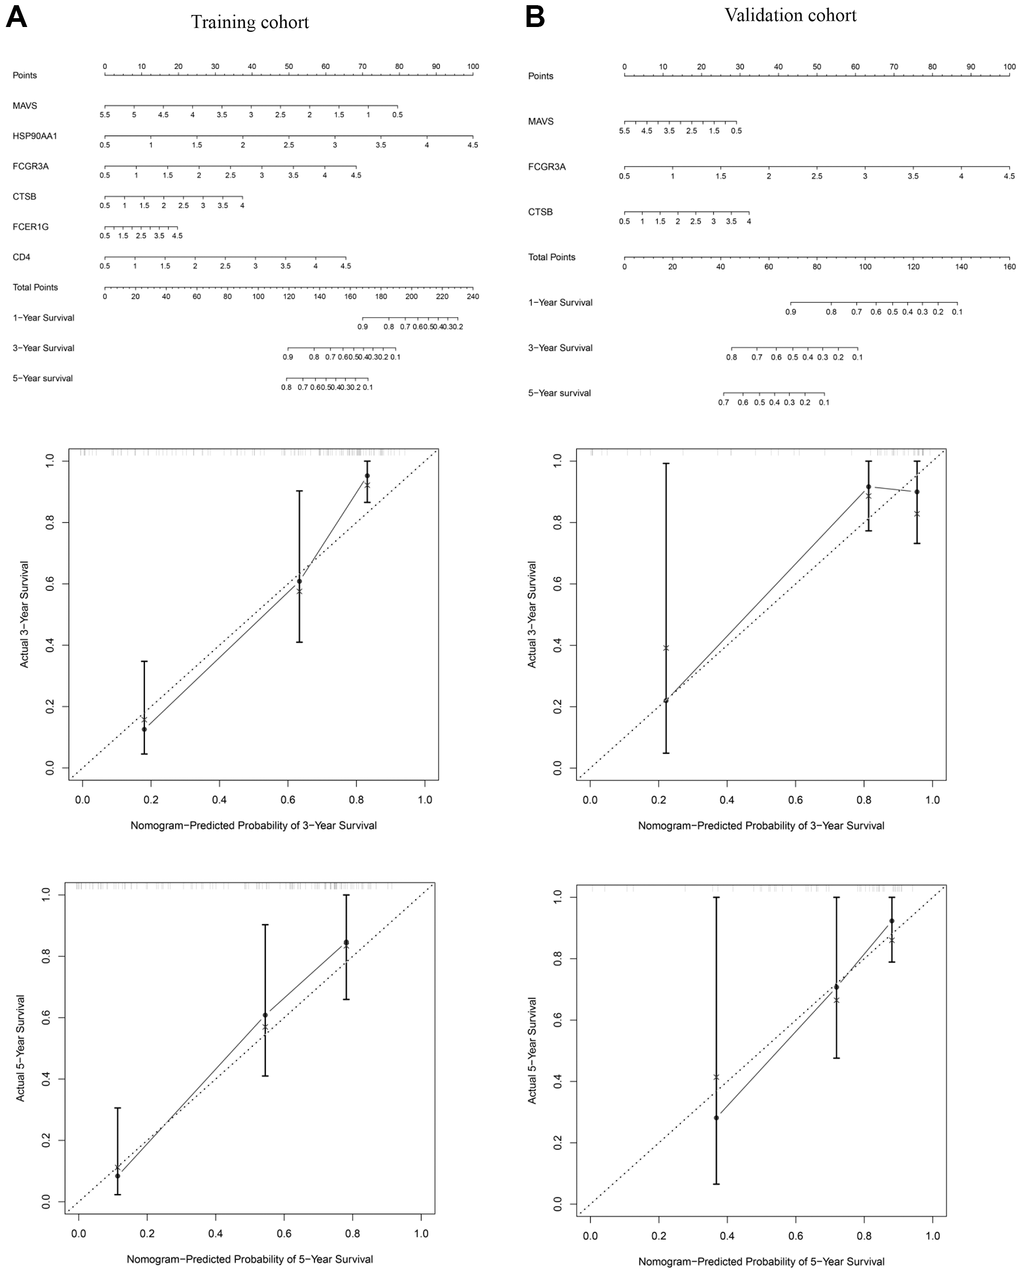
Figure 5.
The nomogram of the OS predictive model for 1, 3, and 5 years.
Nomogram and calibration plot for predicting 1, 3, and 5 years OS model in the training (
A
) and validation (
B
) cohorts.