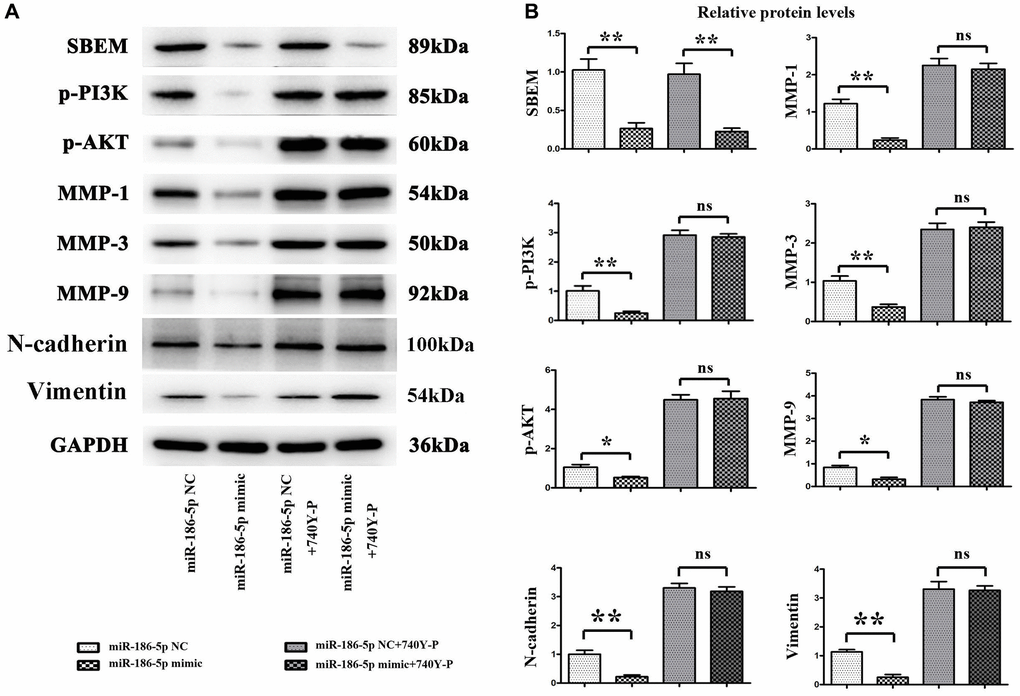
Figure 6.Protein expression changes of SBEM, P-PI3K, p-Akt, T-P38, MMP1, MMP3 and MMP9, vimentin, N-cadherin in MDA-MB-231 cells in each group. (A) Protein bands for SBEM, P-PI3K, p-Akt, T-P38, MMP1, MMP3 and MMP9, vimentin, N-cadherin; (B) Statistics on relative protein expression levels of SBEM, P-PI3K, p-Akt, T-P38, MMP1, MMP3 and MMP9, vimentin, N-cadherin. *P < 0.05 and **P < 0.01 indicated statistically significant differences.