Submit an Article
Navigate
Home
Editorial Board
Editorial Policies
Current Volume
Archive
Scientific Integrity
Publication Ethics Statements
Interviews with Outstanding Authors
Newsroom
Sponsored Conferences
Podcast
Contact
Special Collections
Submit an Article
Online ISSN: 1945-4589
Research Paper
|
Volume 15, Issue 14
|
pp. 6969–6992
Characterization of platelet-related genes and constructing signature combined with immune-related genes for predicting outcomes and immunotherapy response in lung squamous cell carcinoma
Back to article
Figure 9
(9 of 12)
−
100%
+
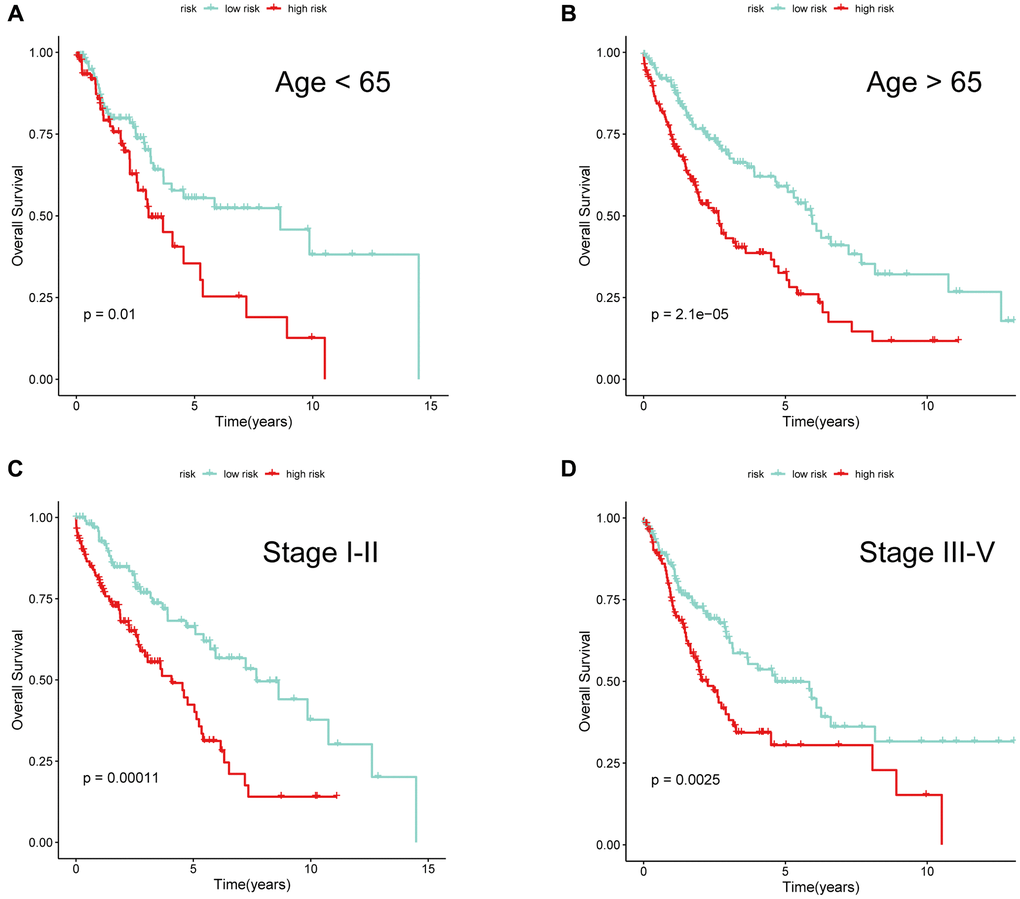
Figure 9.
The performance of 6-gene signature under different clinical characteristics.
KM survival curves for the two risk subgroups of LUSC patients stratified by age (
A
,
B
) and tumor stage (
C
,
D
).