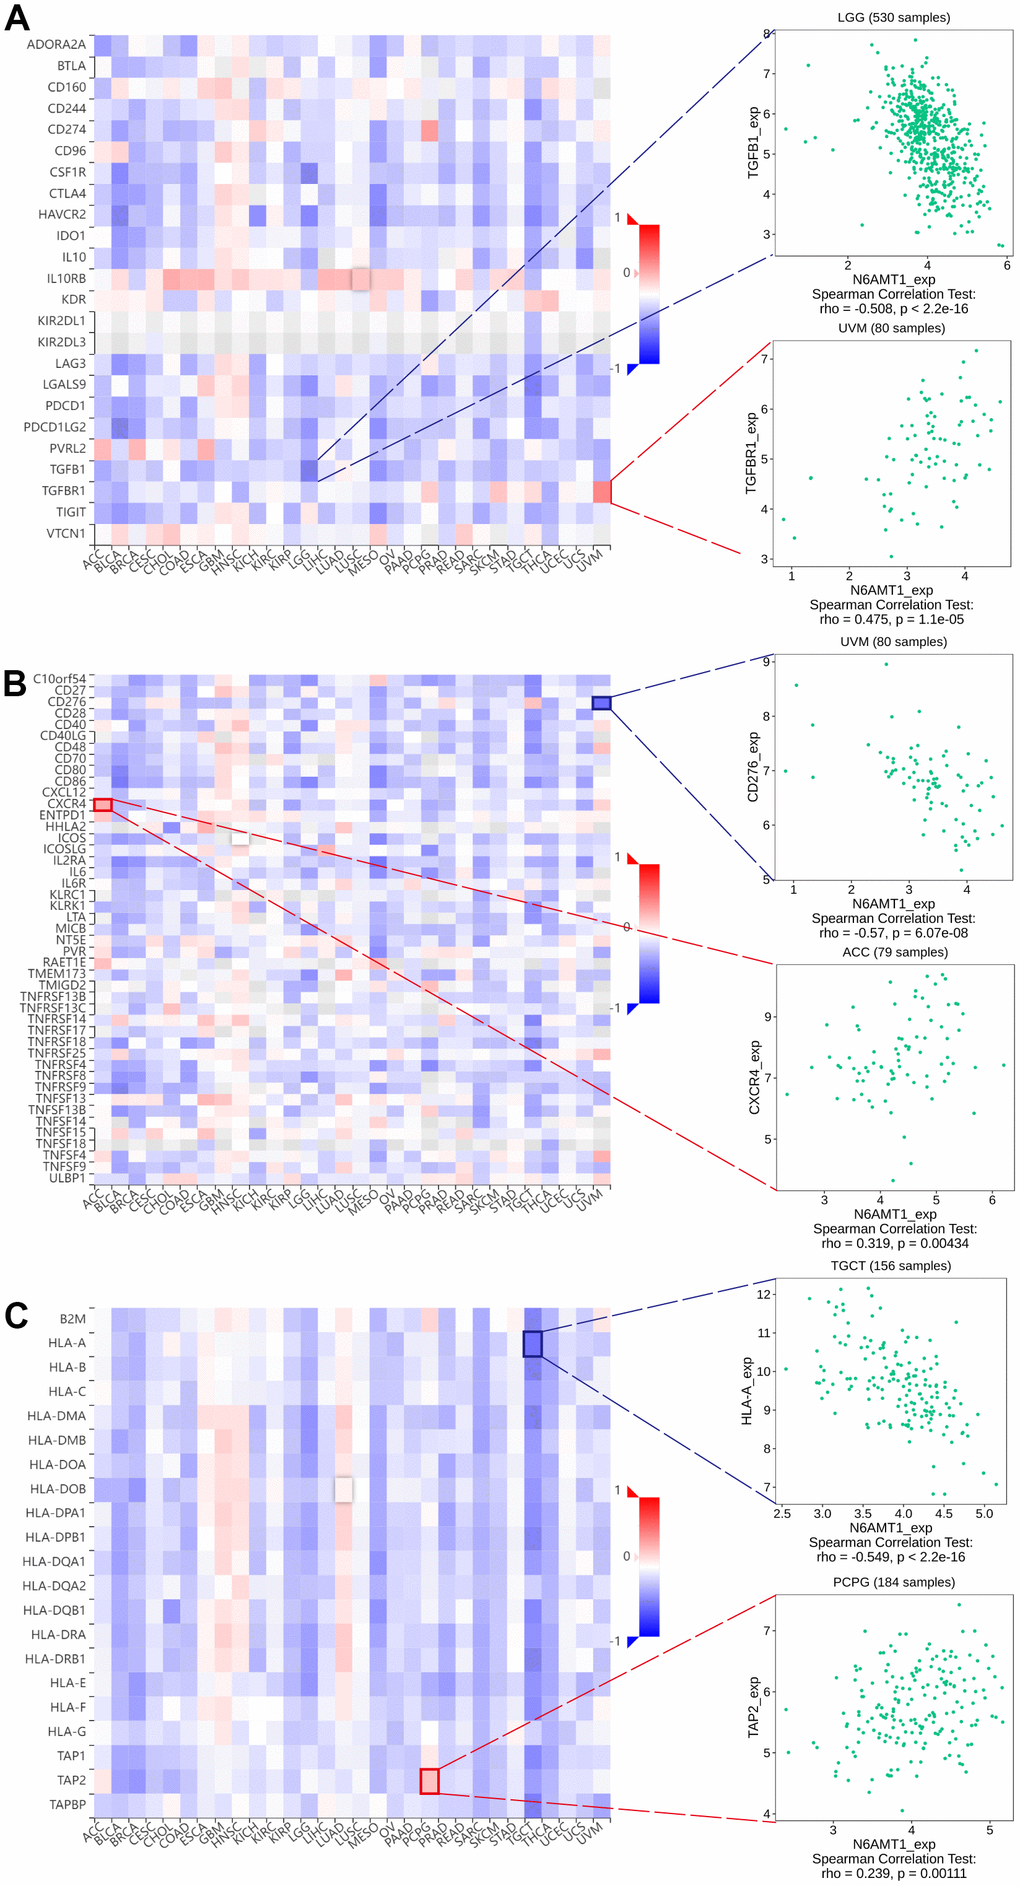
Figure 7.Correlations between N6AMT1 expression and immunomodulators: immunoinhibitors (A), immunostimulators (B) and MHC molecules (C). Red represents positive correlation and blue represents negative correlation. The most positively and negatively correlated cases are highlighted on the right.