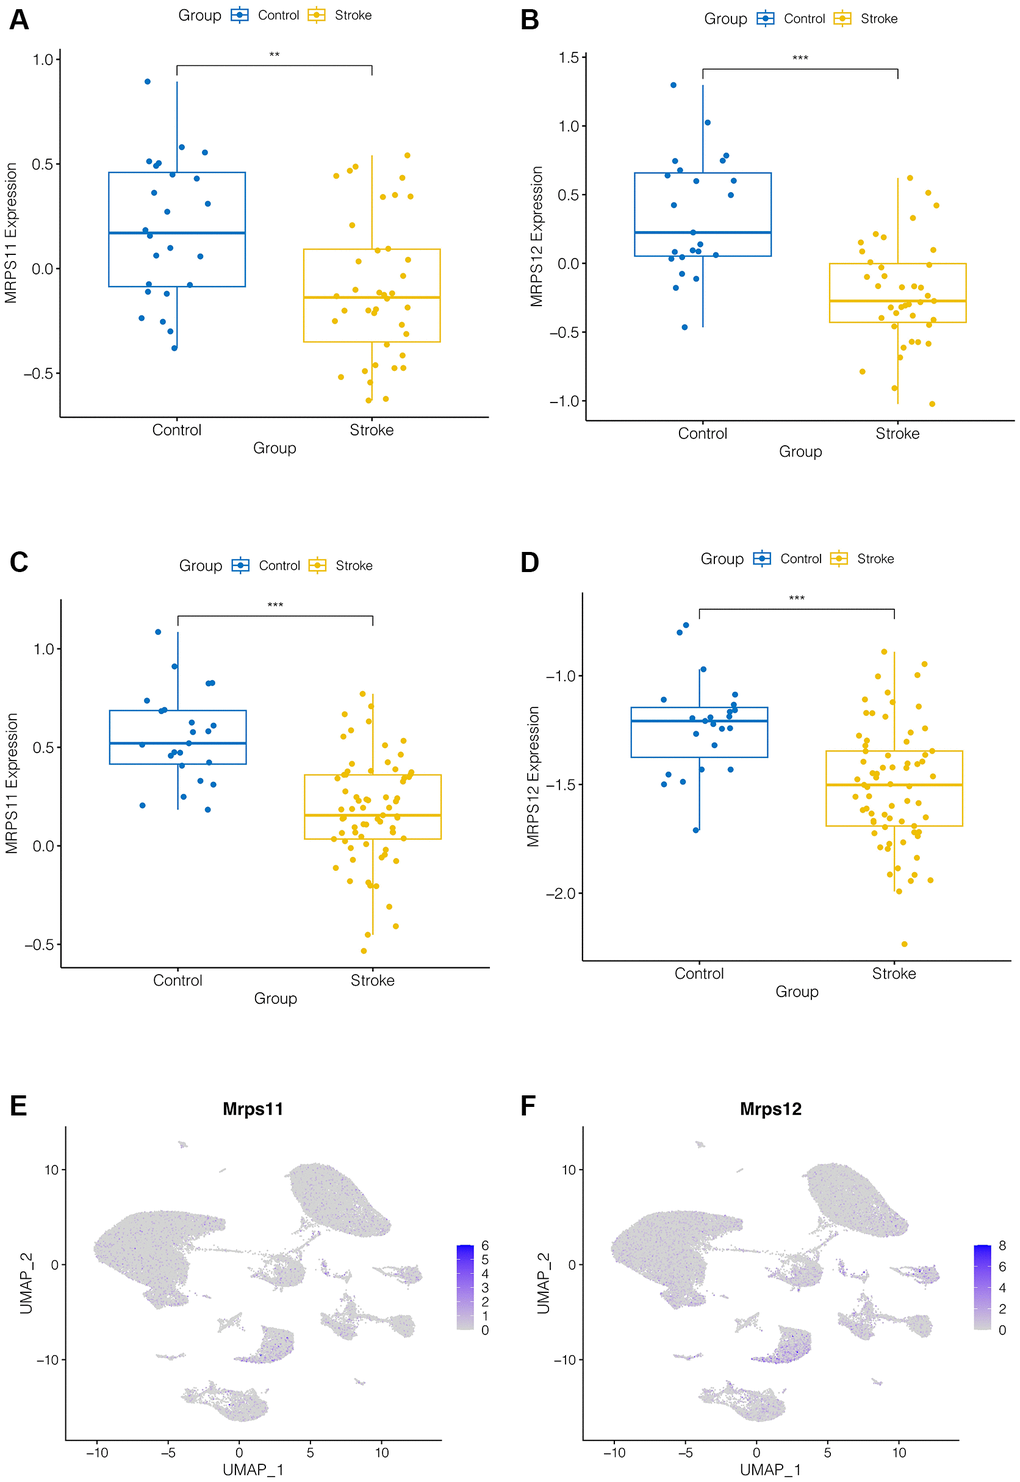
Figure 4.Expression analysis of hub genes. (A–D) MRPS11 and MRPS12 were down-regulated in ischemic stroke patients in the GSE16561 and GSE58294 data sets (p < 0.001). (E, F) Expression analysis of MRPS11 and MRPS12 in single cell data.
Figure 4 — Identification of key biomarkers in ischemic stroke: single-cell sequencing and weighted co-expression network analysis | Aging