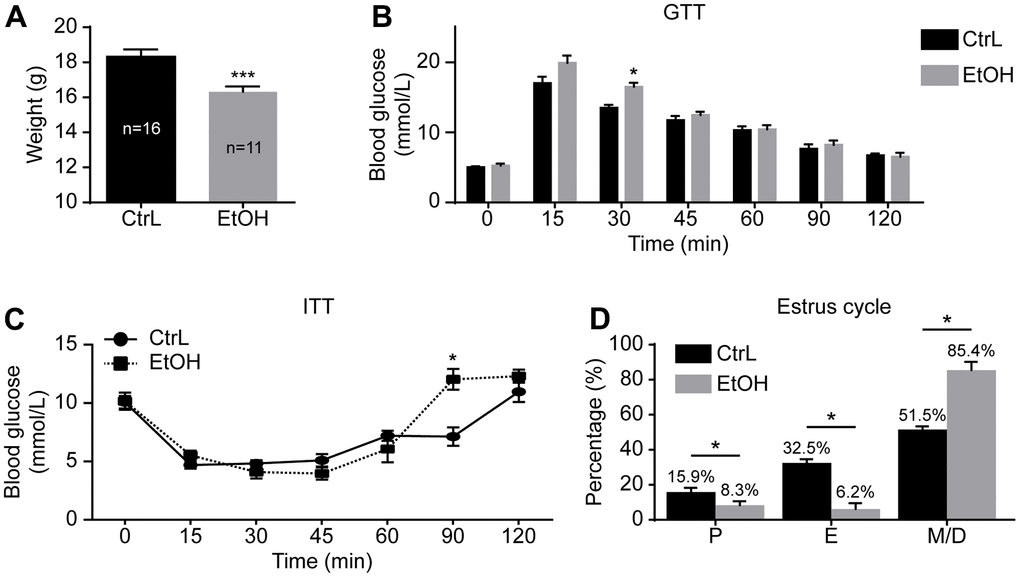
Figure 1.Establishment of prepubertal chronic ethanol-exposed mouse model. (A) Body weight. (B) Blood glucose levels in glucose tolerance test (GTT). (C) Blood glucose levels in insulin resistance test (ITT). (D) Estrous cycle. P, proestrus, E, estrus; M/D, metestrus and diestrus; *, p<0.05. ***, p<0.001.