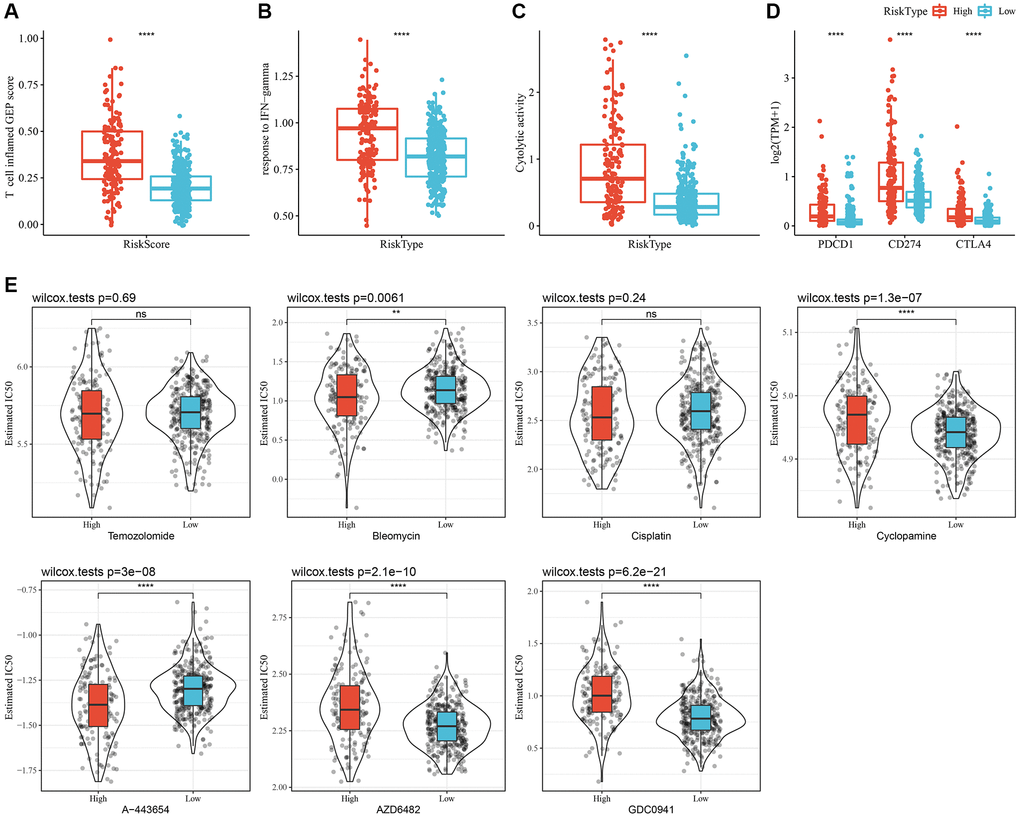
Figure 8.Immunological characteristics and drug sensitivities between different RiskScore groups. (A) The difference in “T cell inflamed GEP score” among various molecular subtypes. (B) The difference in “response to IFN-γ” among various molecular subtypes. (C) The difference in “Cytolytic activity” among various molecular subtypes. (D) Expression differences of immune checkpoint-associated genes among various molecular subtypes. (E) A box plot of the estimated IC50 values for temozolomide, bleomycin, cisplatin, cyclopamine, A-443654, AZD6482, and GDC0941 in TCGA-LGG. **P < 0.01; ****P < 0.0001. Abbreviations: ns: no significance; GEP: gene expression profile; IFN: interferon; TPM: transcripts per million; IC50: half-maximal inhibitory concentration; TCGA: The Cancer Genome Atlas; LGG: low-grade glioma.