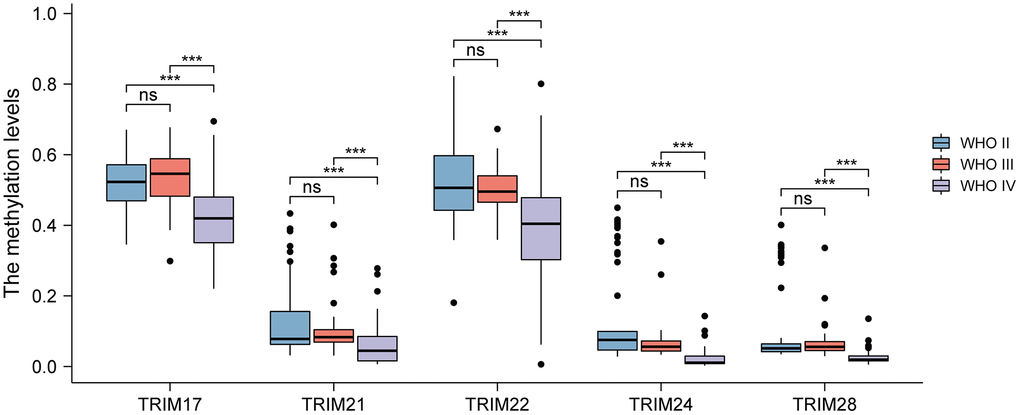
Figure 9.Analyses of the methylation level of the TRIM family in different WHO grades of gliomas. ns, p ≥ 0.05; *p < 0.05; **p < 0.01; ***p < 0.001.
Figure 9 — Comprehensive analysis of the prognostic and immunological signature of eight Tripartitemotif (TRIM) family molecules in human gliomas | Aging