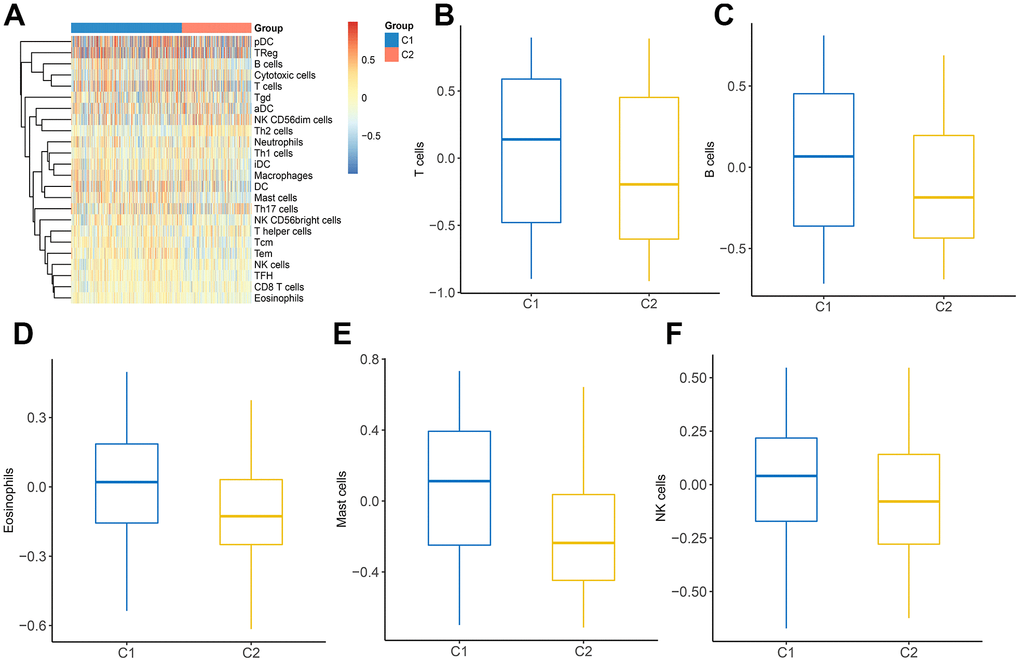
Figure 7.The landscape of immune infiltration between two clusters. (A) Heatmap of immune cell infiltration in two clusters. (B–F) The distribution of various immune cells in C1 and C2 was shown as a box plot.
Figure 7 — Dissecting the alternation landscape of mitochondrial metabolism-related genes in lung adenocarcinoma and their latent mechanisms | Aging