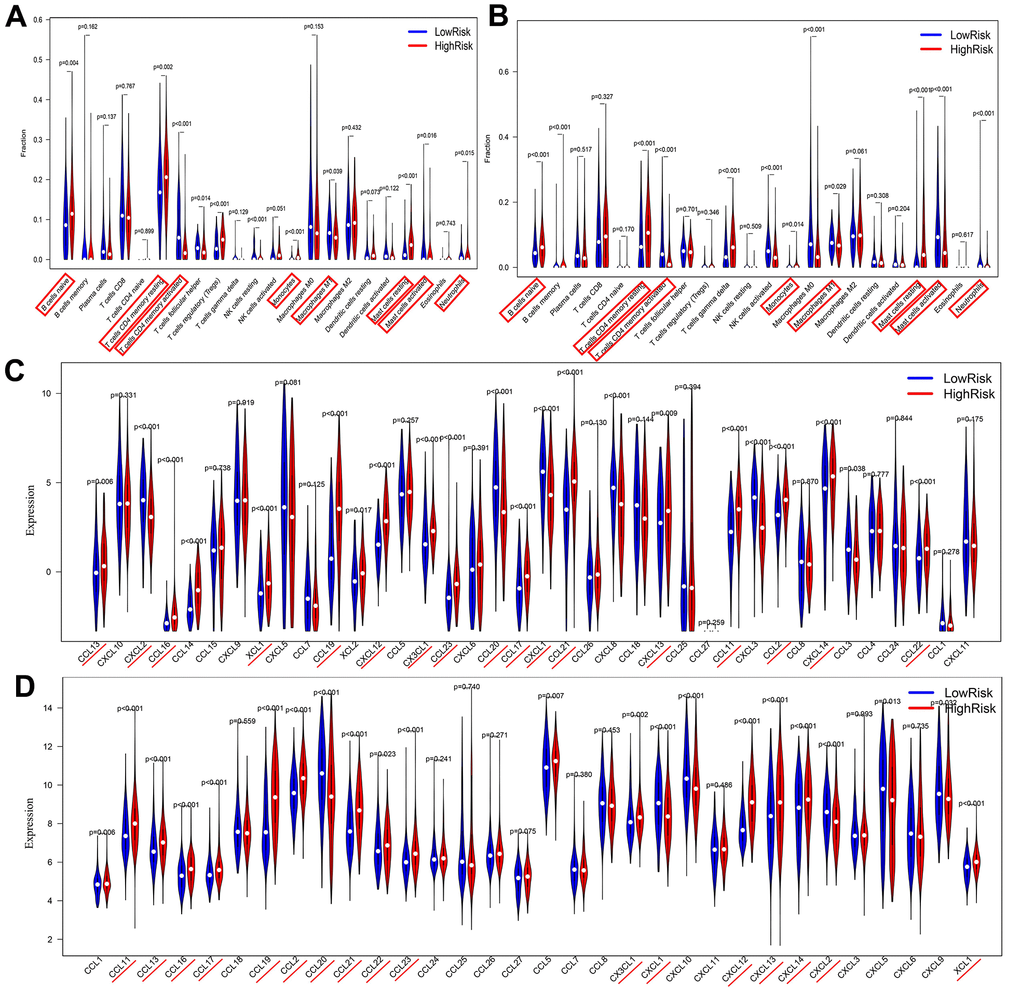
Figure 7.Correlations among risk score, immune cell infiltration and chemokine expression. (A, B) Differential infiltration of immune cells between high- and low-risk groups in the TCGA and GEO databases. (C, D) Differentially expressed chemokines between high- and low-risk groups in TCGA and GEO databases..
(E, F) Co-expression pattern of immune cells and chemokines in TCGA and GEO databases. (Red box represents consistent trend in both databases) (G) Correlation between MIR99AHG and chemokines of interest. (H) Survival analysis of the selected immune cells.