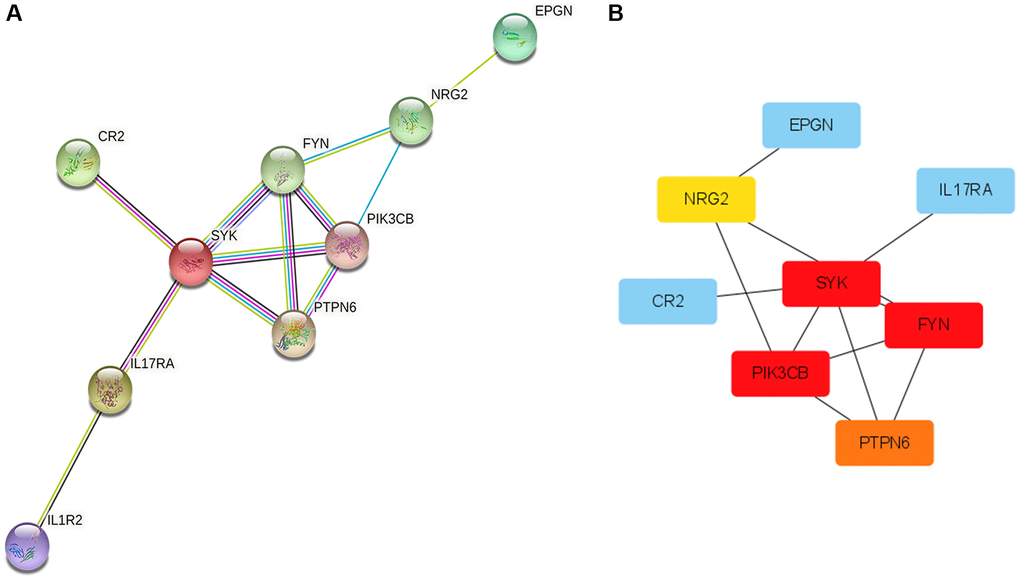
Figure 8.Protein-Protein Interaction (PPI) network and hub genes. (A) The plot of PPI. Edges represent protein-protein associations, blue edges: known interaction from curated databases, rose red edges: experimentally determined interaction, purple edges: protein homology, green edges: neighborhood genes, black edges: co-expression genes. (B) The plot of hub genes.