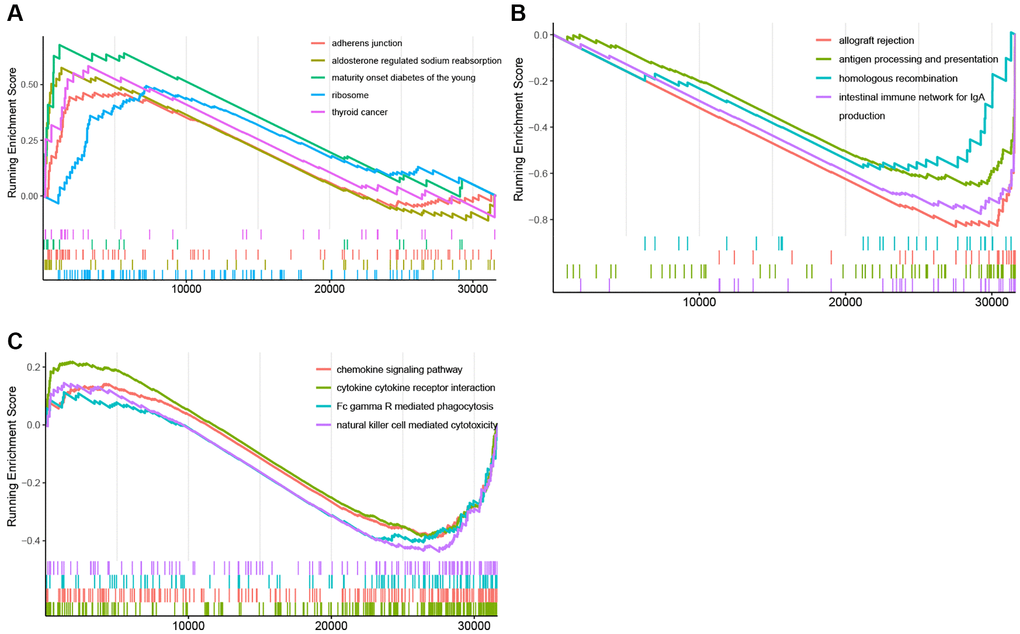
Figure 5.GSEA plots of Hallmark pathway. (A) GSEA plots of the activated Hallmark pathways in the KRAS-mutated group. (B, C) GSEA plots of the suppressed Hallmark pathways in the KRAS-mutated group.
Figure 5 — Immune landscape and prognostic immune-related signature in KRAS-mutated lung adenocarcinoma | Aging