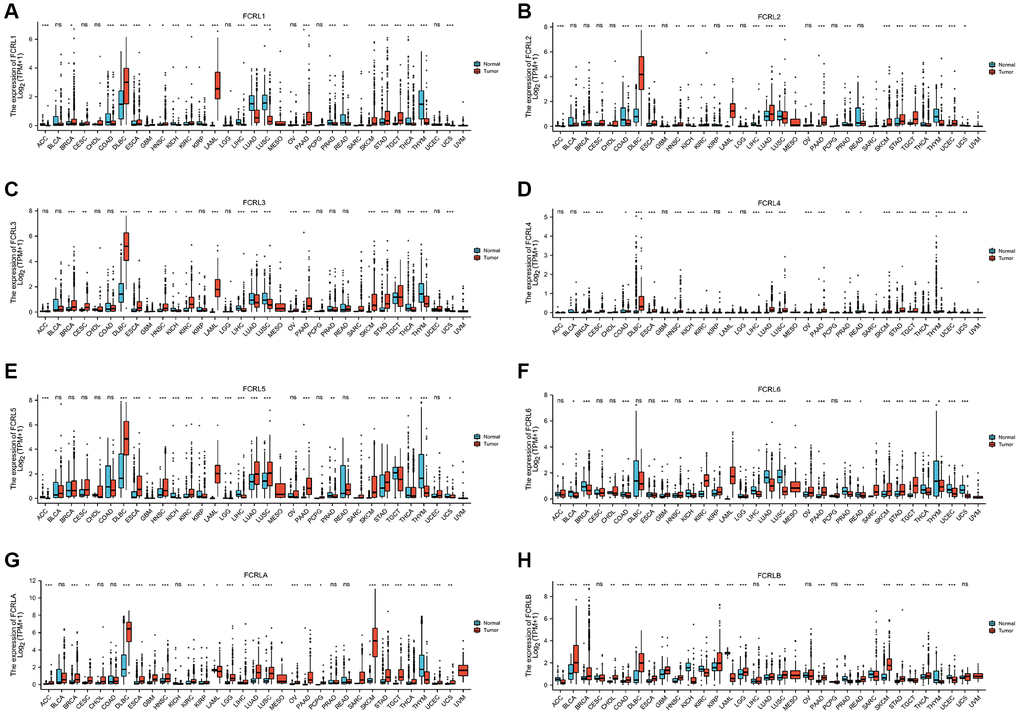
Figure 1.mRNA expression profile of FCRL family gene in 33 cancers. Expression of (A) FCRL1, (B) FCRL2, (C) FCRL3, (D) FCRL4, (E) FCRL5, (F) FCRL6, (G) FCRLA, (H) FCRLB mRNA in 33 cancers and normal tissues in unpaired sample analysis. ∗p < 0.05, ∗∗p < 0.01, ∗∗∗p < 0.001.