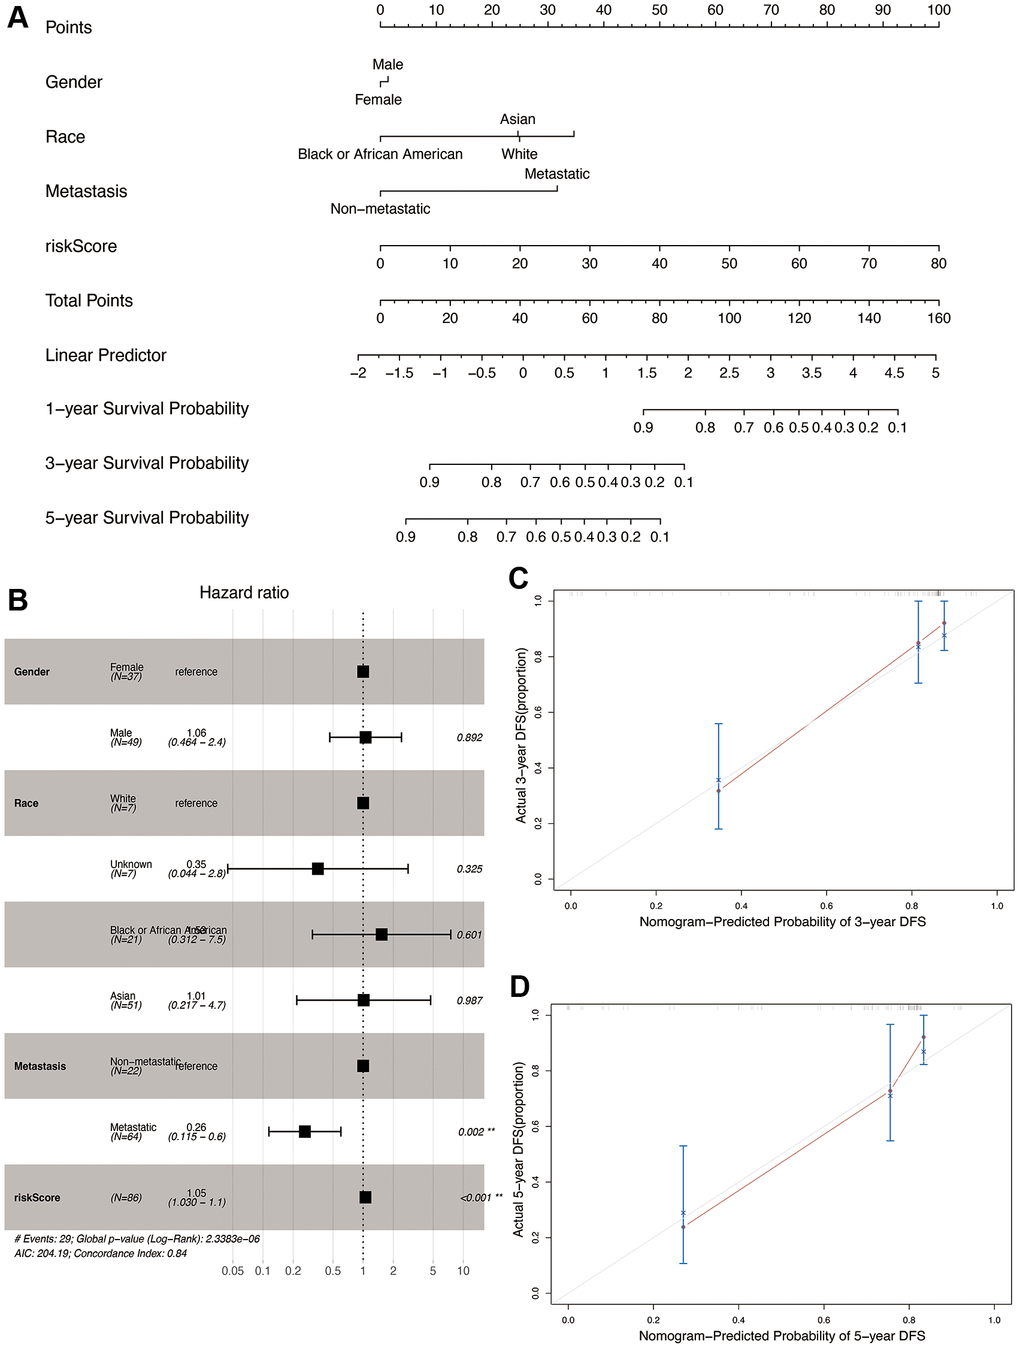
Figure 9.Construction and validation of the nomogram in the TARGET cohort. (A) Nomogram combining OS-related risk score and clinical characteristics for predicting 1-, 3-, and 5-year overall survival of osteosarcoma patients. (B) Forest plot showing results of multivariable cox regression of the nomogram. (C, D) The calibration curves for 3- and 5-year overall survival probability.