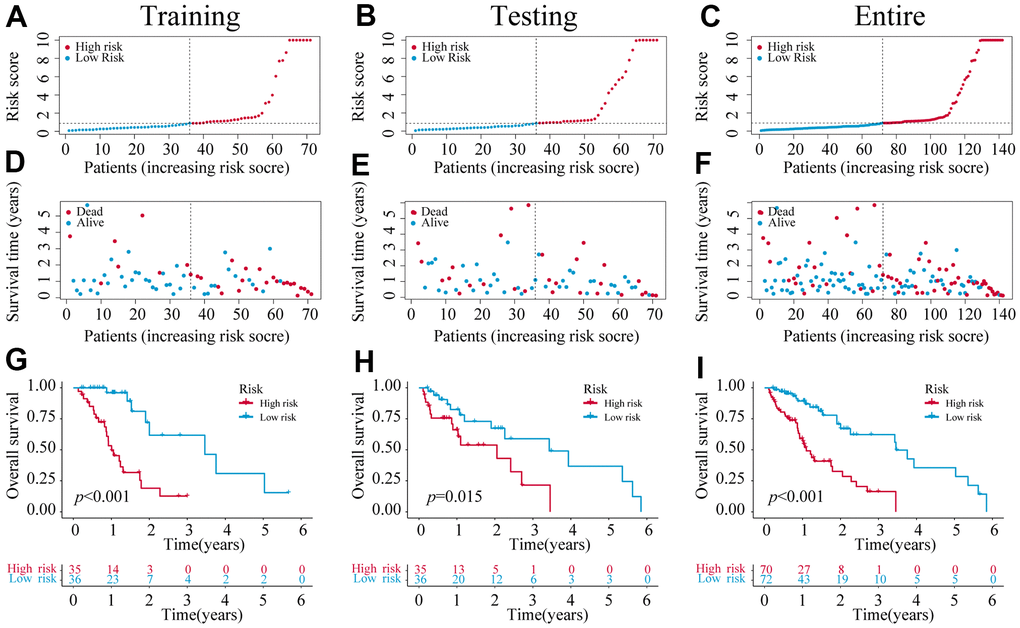
Figure 3.The construction of a 6-NRLs prognostic signature. (A–C) The risk score of six prognostic NRLs. (D–F) Survival status distribution of six prognostic NRLs. (G–I) Kaplan–Meier survival curves of high-risk and low-risk patients in training, testing, and entire groups.