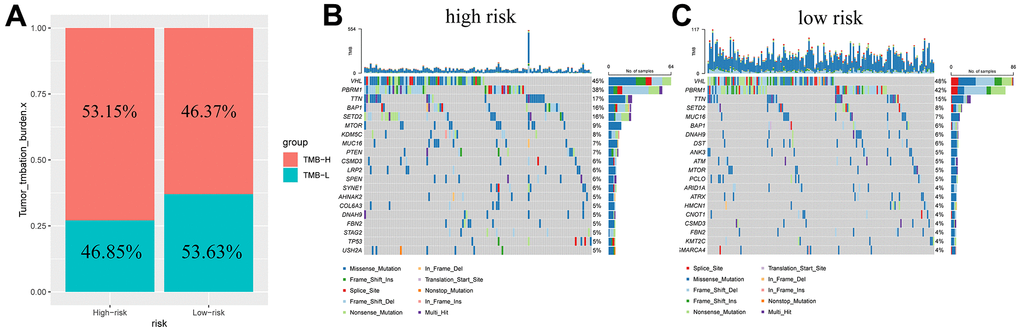
Figure 7.Tumor mutation burden in different risk groups. Percentage bar graph showing TMB for different risk subgroups (A); High-risk group waterfall chart (B); Low-risk group waterfall chart (C).
Figure 7 — Construction and validation of a model based on immunogenic cell death-associated lncRNAs to predict prognosis and direct therapy for kidney renal clear cell carcinoma | Aging