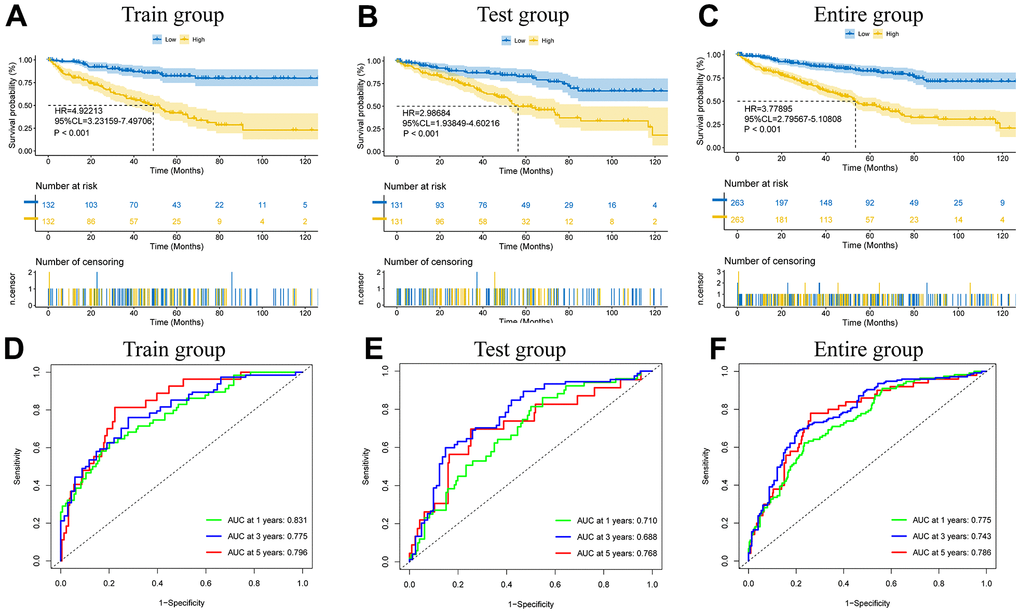
Figure 3.The model prediction effect is validated by the training group, test group, and entire group. K-M analysis (A–C) and Time-dependent ROC curves (D–F) to compare the survival of the high-risk group and low-risk group.
Figure 3 — Construction and validation of a model based on immunogenic cell death-associated lncRNAs to predict prognosis and direct therapy for kidney renal clear cell carcinoma | Aging