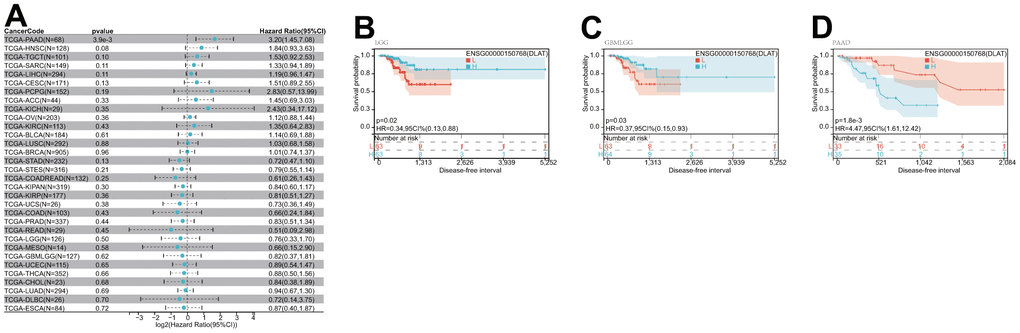
Figure 5.Relationship of DLAT expression with patient DFI. (A) Forest map shows the univariate Cox regression analysis results for DLAT in TCGA pan-cancer samples. (B–D) Kaplan–Meier DFI curves of DLAT expression in the three significantly associated tumors.