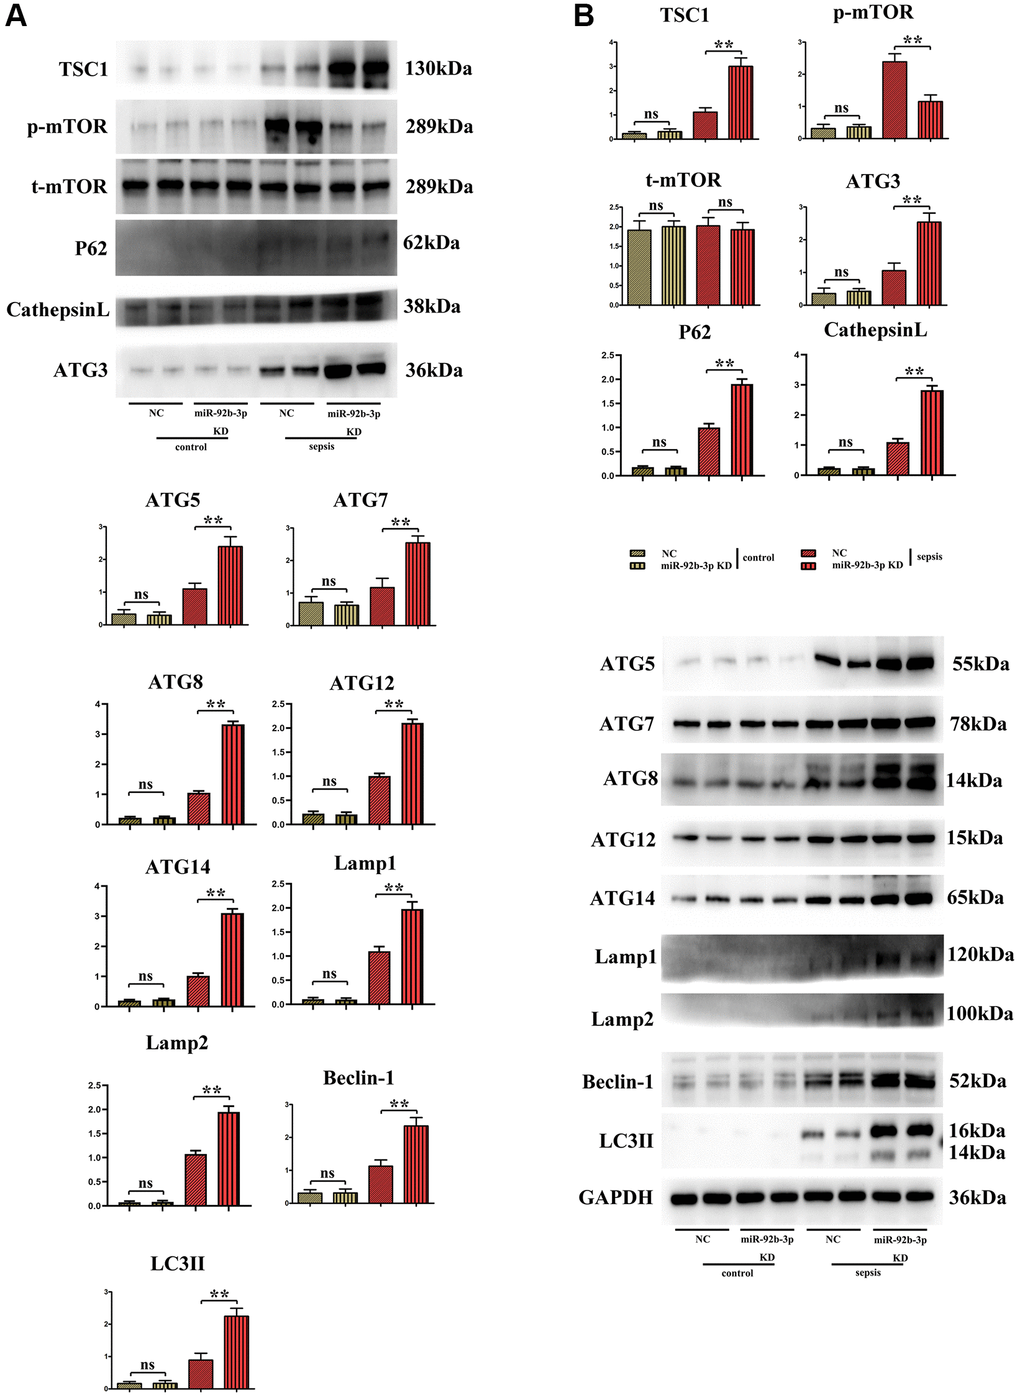
Figure 5.Expressions of autophagy/mTOR pathway-related proteins in mouse myocardium. (A) Relative expression of autophagy/mTOR pathway-related proteins in mouse myocardium; (B) Strip plot of autophagy/mTOR pathway-related proteins in mouse myocardium. **p < 0.01; ns p > 0.05.