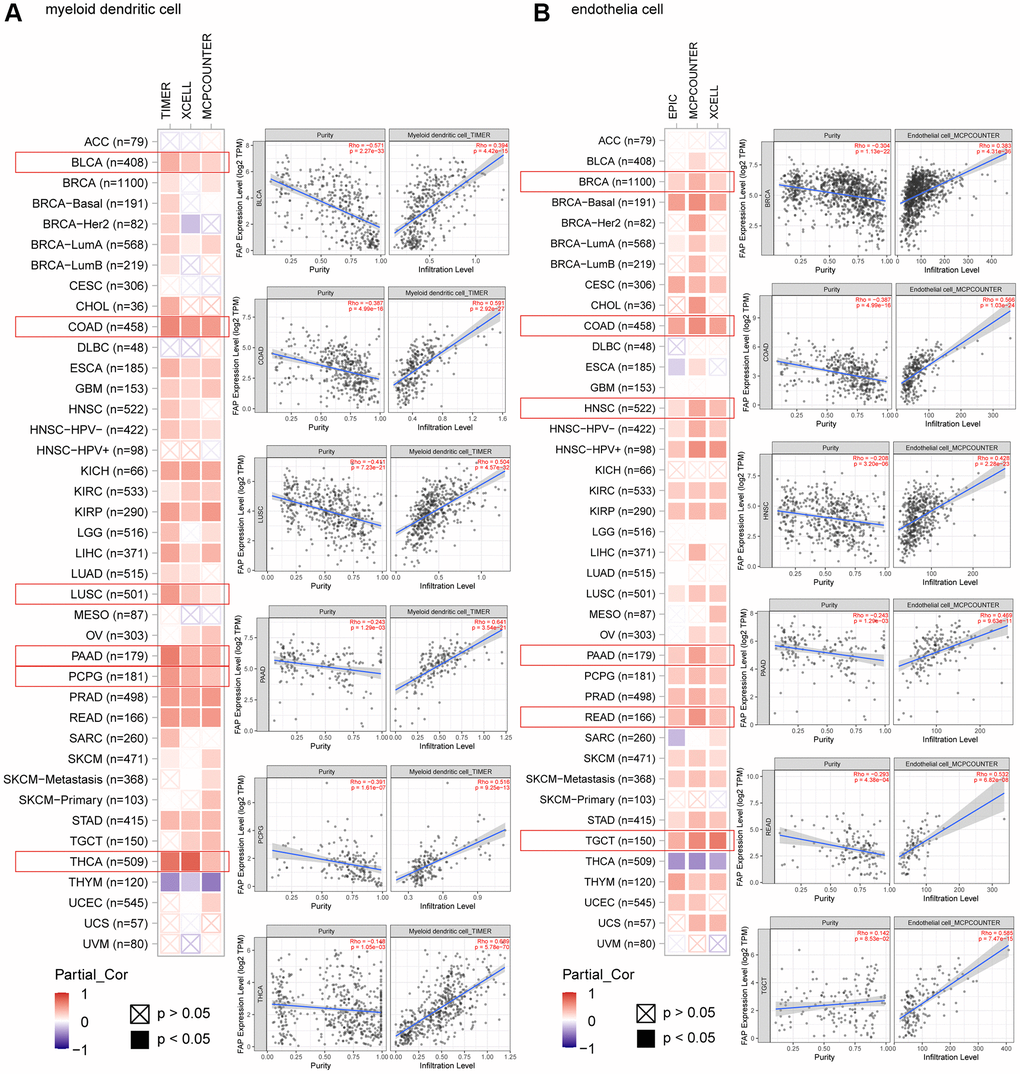
Figure 7.Correlation analysis between FAP expression and infiltration of (A) myeloid dendritic cells and (B) endothelia cells by different algorithms. Classic scatter plotters were presented.
Figure 7 — Comprehensive analysis of the oncogenic and immunological role of FAP and identification of the ceRNA network in human cancers | Aging