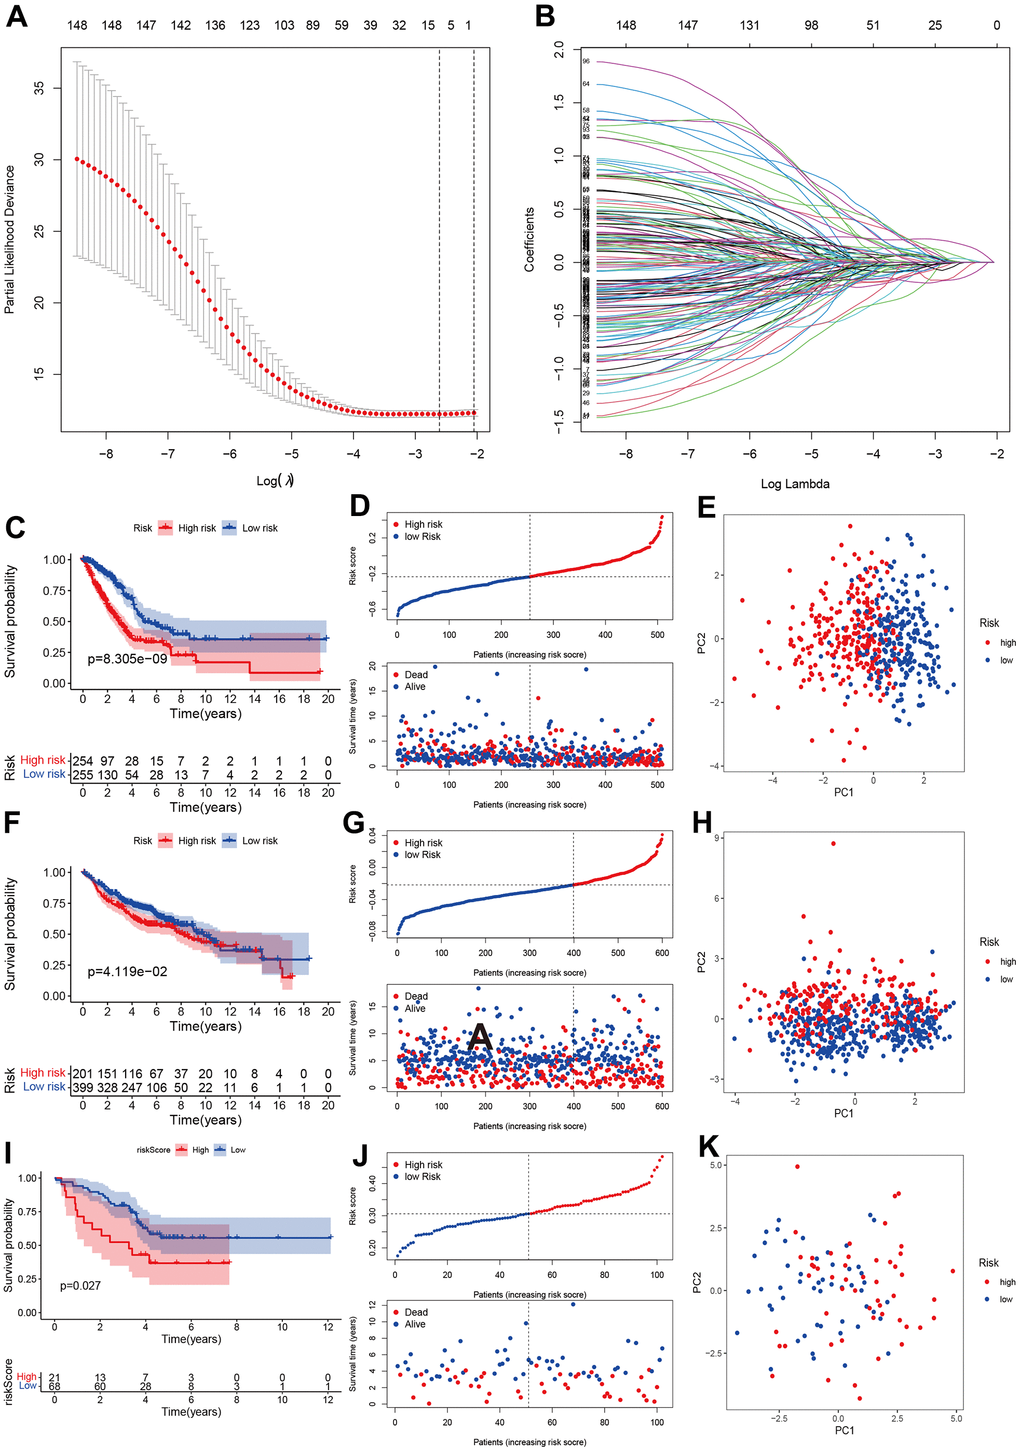
Figure 3.Development and validation of prognostics model based on CRs. (A, B) LASSO regression identified optimal gene number in the model. (C–E) Kaplan-Merri survival curve, risk score and risk components in TCGA training group. (F–H) Kaplan-Merri survival curve, risk score (best cut-off value) and risk components in GEO validation dataset (GSE31210, GSE37445, GSE50081, GSE19188, GSE30219); (I–K) Kaplan-Merri survival curve, risk score and risk components in ArrayExpress validation dataset (E-MTAB-923).