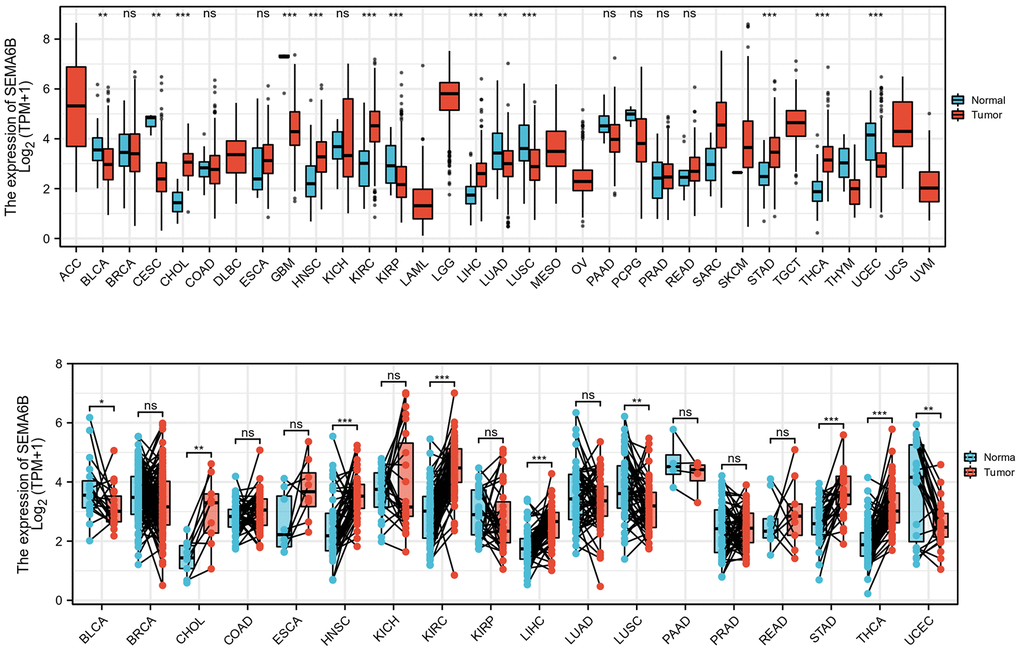
Figure 11.Expression comparison of SEMA6B mRNA level in matched tumor and adjacent normal tissue from multiple malignancies. SEMA6B mRNA level was calculated from RNA-seq data from tumor sample and match normal tissue in TCGA database (n=17 for normal tissues, n=18 for tumor tissues).