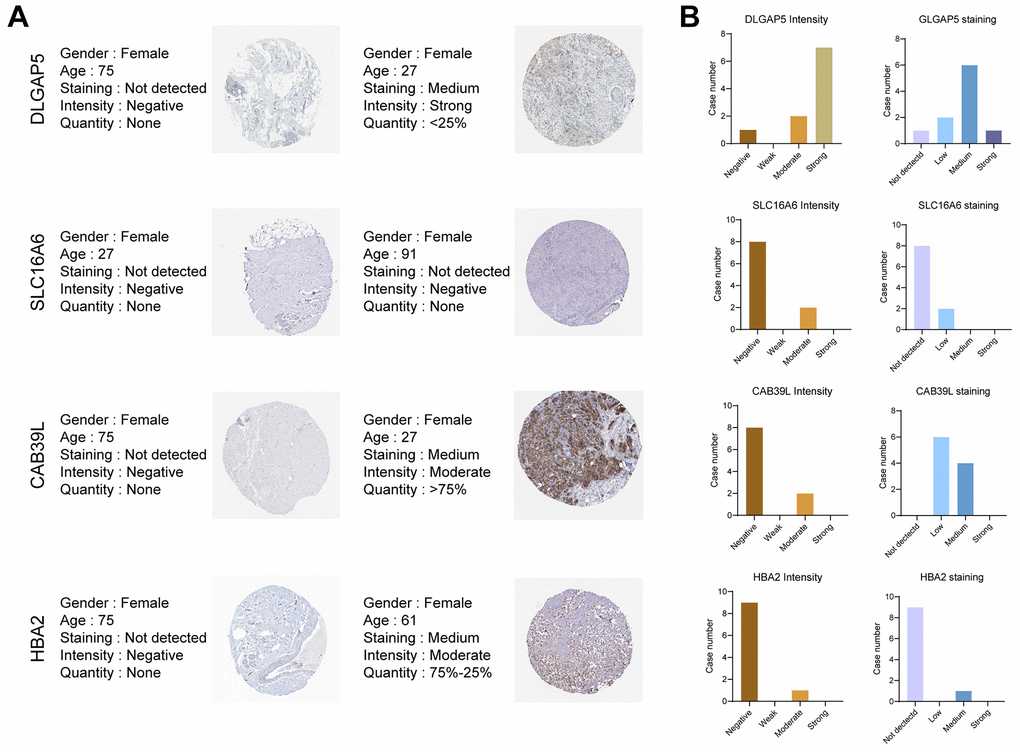
Figure 11.Validation of the 5 BCCGs in normal breast tissue and BC tissue. (A) IHC staining of protein expression for 5 BCCGs. (B) Bar charts represent IHC staining and intensities for five BCCGs.
Figure 11 — A novel signature based on cancer-associated fibroblast genes to predict prognosis, immune feature, and therapeutic response in breast cancer | Aging