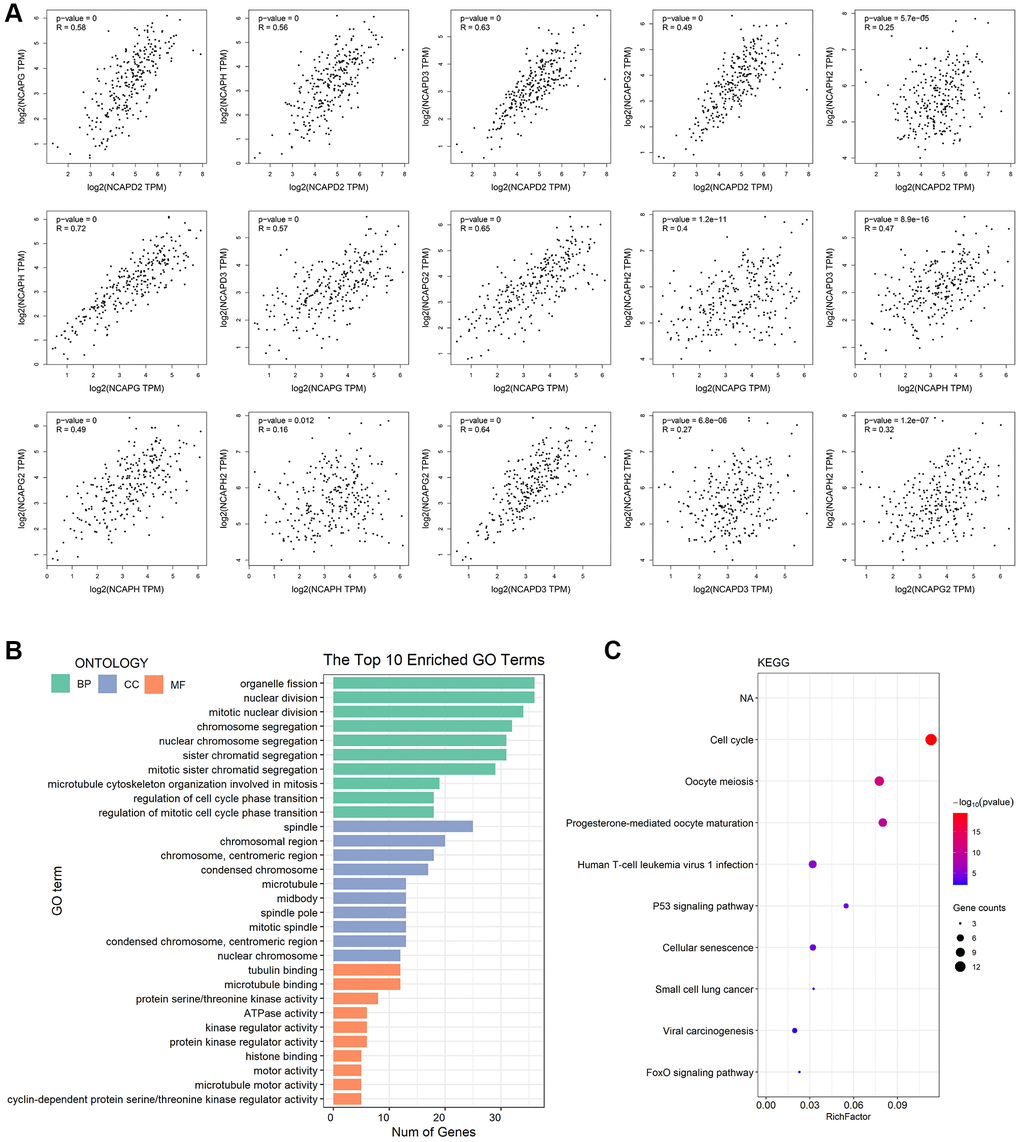
Figure 6.Co-expressed analysis, GO analysis, and functional enrichment analysis of NCAP and their interacting genes. (A) Correlation between NCAP genes in sarcoma. (B) GO analysis was based on three aspects. Abbreviations: BP: biological processes; CC: cellular components; MF: molecular function. (C) KEGG pathway related to NCAP genes and their interacting genes in sarcoma.