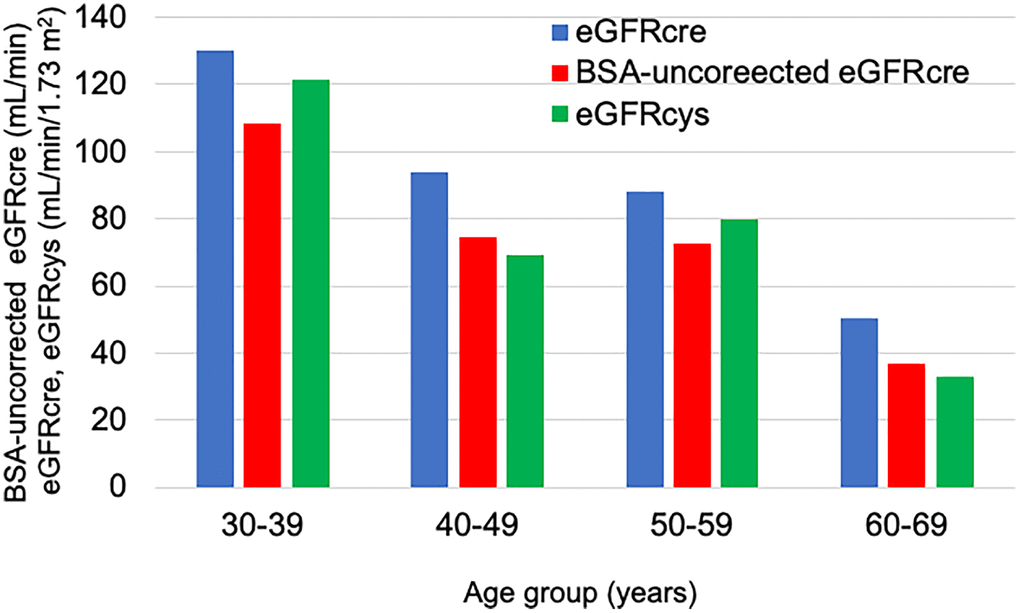
Figure 1.Average renal function in each age group over the entire survey period. The blue bar shows the eGFRcre. The red bar shows the BSA-uncorrected eGFRcre. The green bar shows the eGFRcys.
Figure 1 — Renal dysfunction, malignant neoplasms, atherosclerotic cardiovascular diseases, and sarcopenia as key outcomes observed in a three-year follow-up study using the Werner Syndrome Registry | Aging