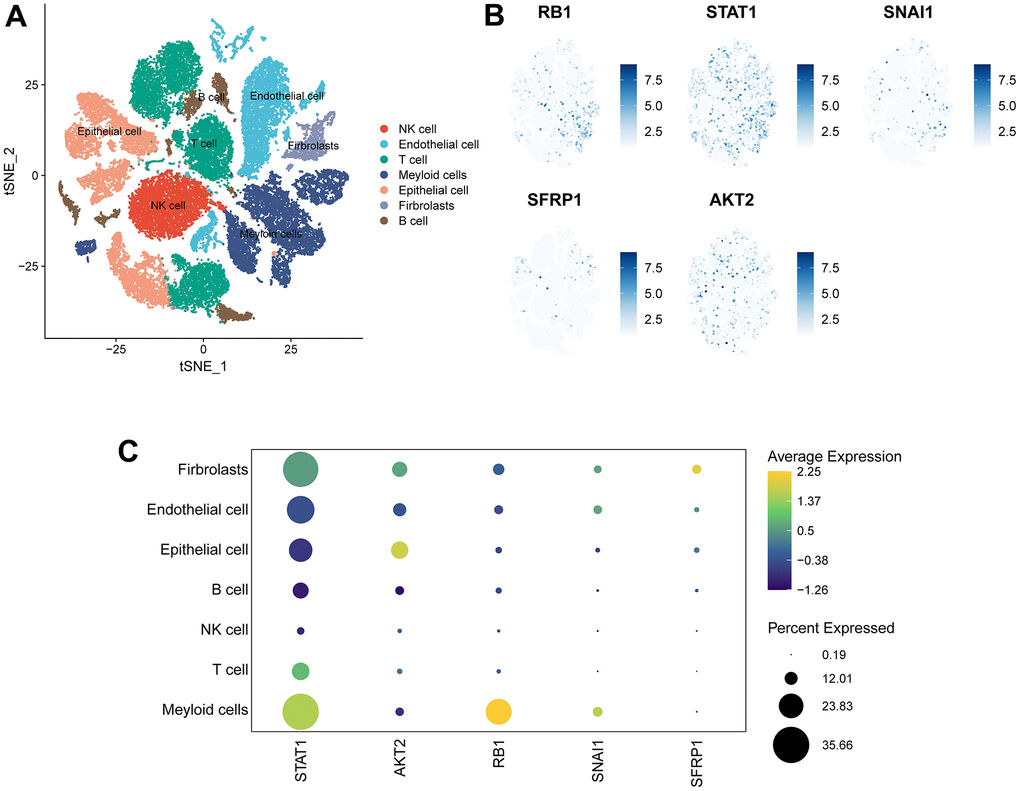
Figure 8.Expression of 5 signature genes in OV TME-associated cells. (A) TSNE visualization of 43,057 single cells, color-coded by cell type. (B) Feature plots depicting the expressions of 5 signature genes (RB1, SNAI1, STAT1, SFRP1, AKT2) in all cell types. (C) Dotplot showing the percentages and expressions of 5 signature genes (RB1, SNAI1, STAT1, SFRP1, AKT2) among all cell types.