Submit an Article
Navigate
Home
Editorial Board
Editorial Policies
Current Volume
Archive
Scientific Integrity
Publication Ethics Statements
Interviews with Outstanding Authors
Newsroom
Sponsored Conferences
Podcast
Contact
Special Collections
Submit an Article
Online ISSN: 1945-4589
Research Paper
|
Volume 15, Issue 6
|
pp. 2136–2157
The cell senescence regulator p16 is a promising cancer prognostic and immune check-point inhibitor (ICI) therapy biomarker
Back to article
Figure 3
(3 of 6)
−
100%
+
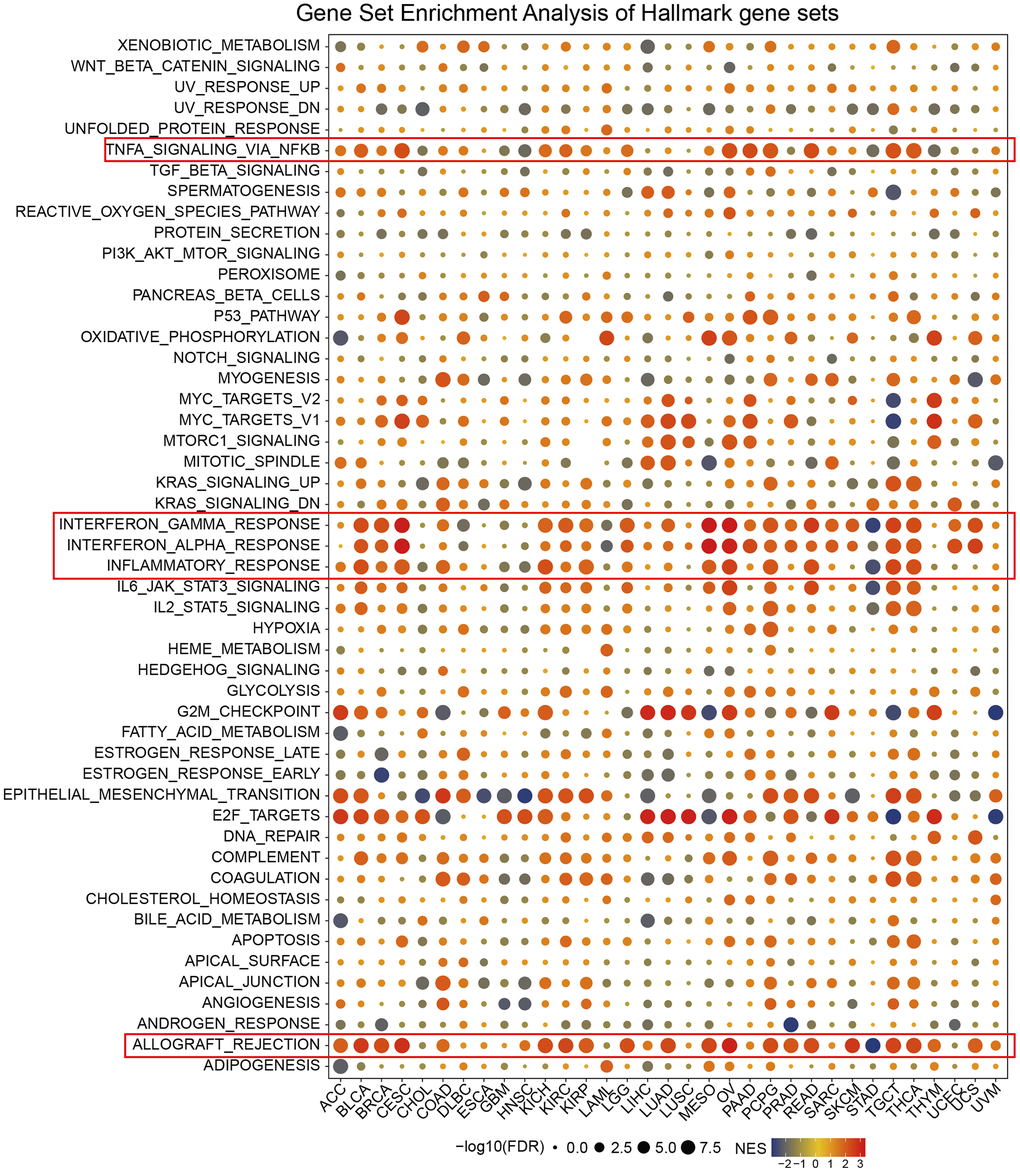
Figure 3.
Enrichment analysis of CDKN2A marker gene set in pan-cancer.
The circle size represents the FDR value of the enrichment term about each cancer. The color signifies the normalized enrichment score (NES).