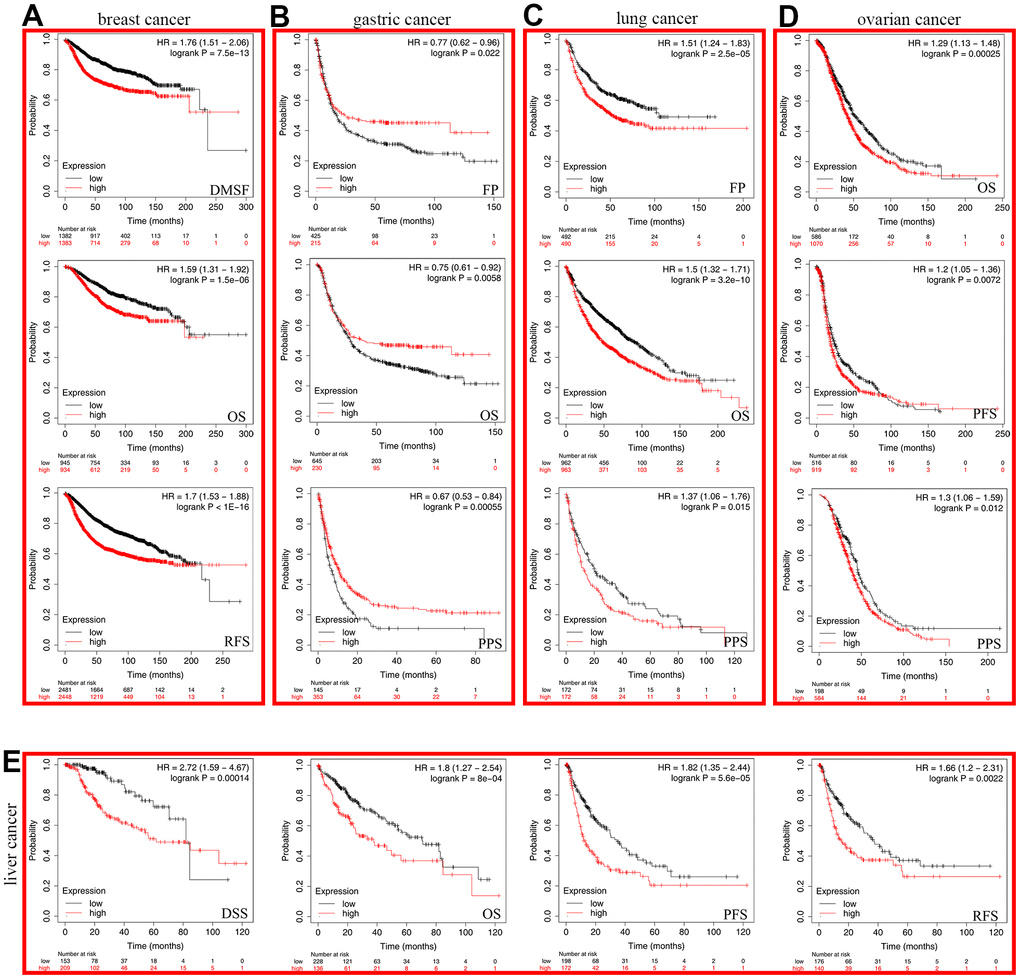
Figure 3.The Kaplan-Meier plotter was used to analyze the prognostic role of cancer patients. (A) breast cancer (B) gastric cancer (C) lung cancer (D) ovarian cancer (E) liver cancer.
Figure 3 — Characterization of SHCBP1 to prognosis and immunological landscape in pan-cancer: novel insights to biomarker and therapeutic targets | Aging