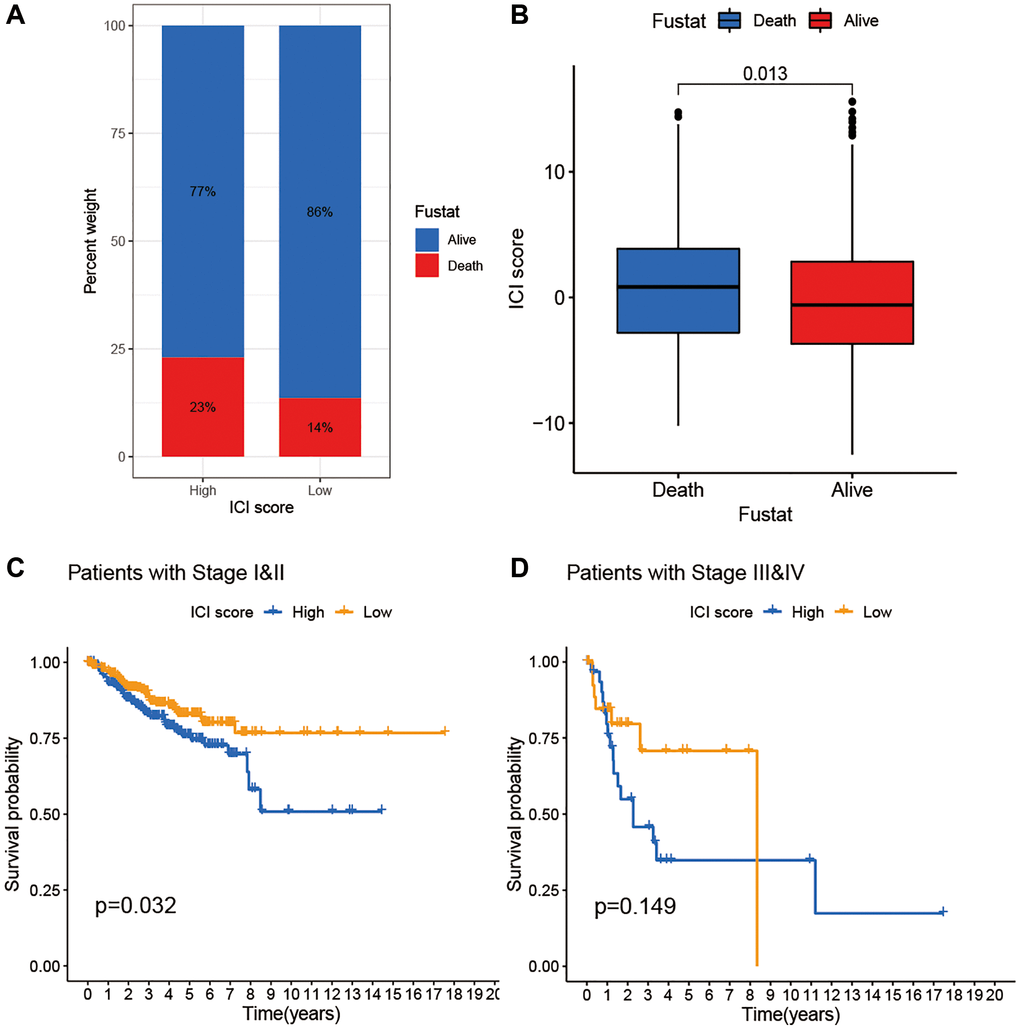
Figure 5.The association of ICI scores and clinical characteristics. (A) Rate of survival status of BC patients in the high and low ICI score group. (B) Distribution of survival status in the two groups. (C) Kaplan-Meier curves analysis for patients with Stage I and II. (D) Kaplan-Meier curves analysis for patients with Stage III and IV.