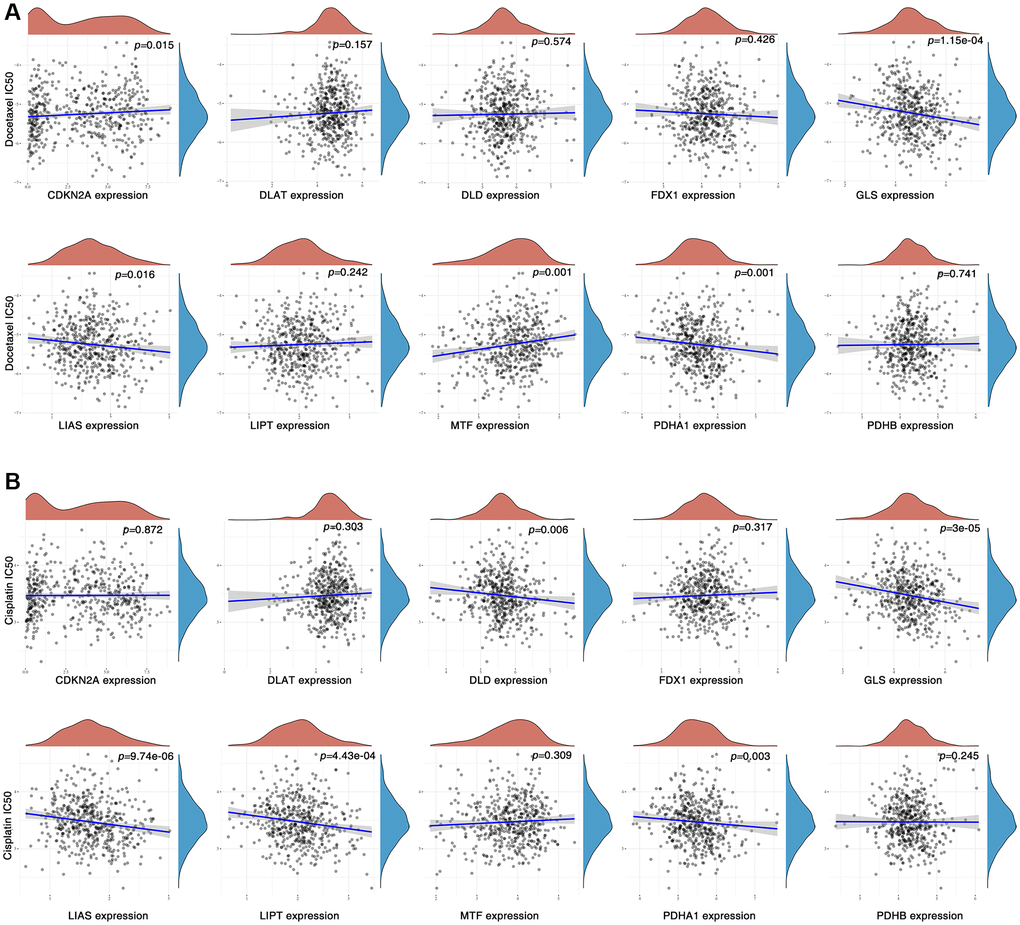
Figure 8.Correlation between CAGs expression and drug sensitivity. (A, B) Spearman correlation analysis of cisplatin (A) docetaxel (B) IC50 score and CAG expression.
Figure 8 — Clinical significance and integrative analysis of the cuproptosis-associated genes in head and neck squamous cell carcinoma | Aging