Submit an Article
Navigate
Home
Editorial Board
Editorial Policies
Current Volume
Archive
Scientific Integrity
Publication Ethics Statements
Interviews with Outstanding Authors
Newsroom
Sponsored Conferences
Podcast
Contact
Special Collections
Submit an Article
Online ISSN: 1945-4589
Research Paper
|
Volume 15, Issue 6
|
pp. 1964–1976
Clinical significance and integrative analysis of the cuproptosis-associated genes in head and neck squamous cell carcinoma
Back to article
Figure 2
(2 of 8)
−
100%
+
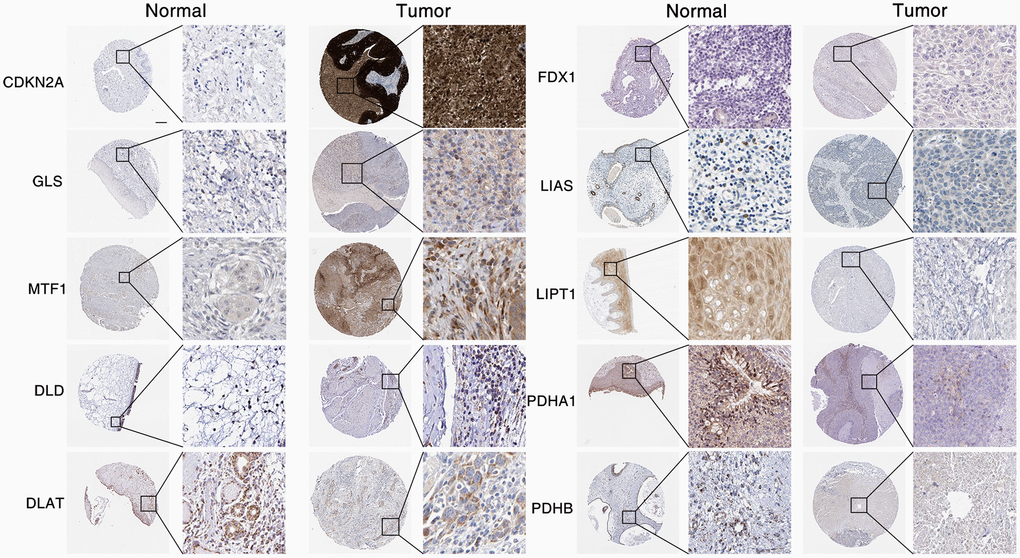
Figure 2.
Expression of CAGs in HNSC.
CAGs expression data from The Human Protein Atlas database in tumor with or normal tissue were measured by immunohistochemical staining. Scale bar, 20 μm.