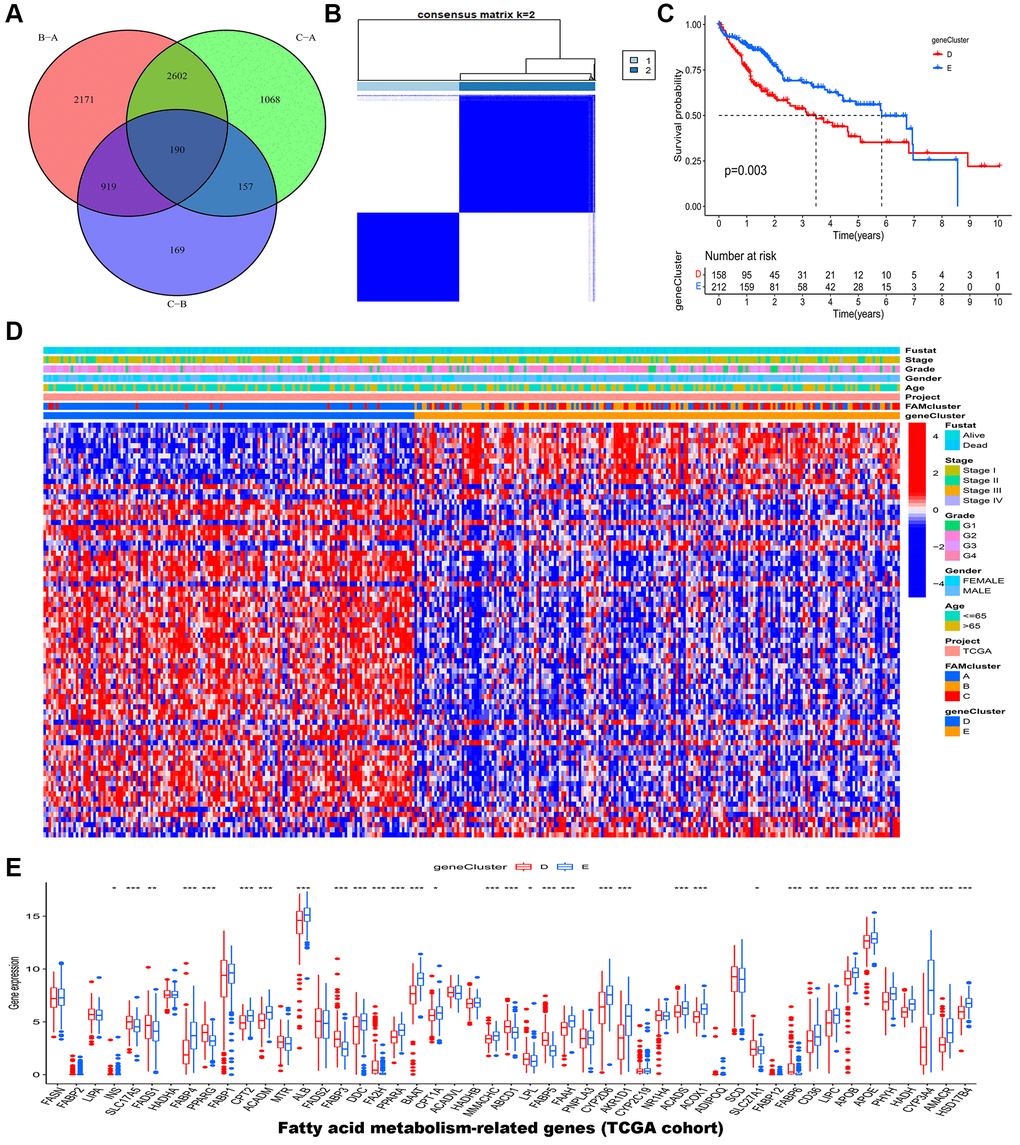
Figure 4.Identification of gene clusters based on DEGs in the TCGA-LIHC cohort. (A) Venn diagram showed the DEGs among the three FAM clusters. (B) HCC samples were divided into two clusters based on the consensus clustering (k = 2). (C) The OS analysis of HCC samples between gene cluster D and E. (D) The heatmap of clinical characteristics of HCC patients in different clusters. (E) The mRNA expression levels of 49 FAMs between gene cluster D and E. Abbreviations: DEGs: different expressed genes; TCGA: the Cancer Genome Atlas; LIHC: liver hepatocellular carcinoma; FAM: fatty acid metabolism; HCC: hepatocellular carcinoma; OS: overall survival; FAMs: fatty acid metabolism-related genes. *p < 0.05; **p < 0.01; ***p < 0.001.