Submit an Article
Navigate
Home
Editorial Board
Editorial Policies
Current Volume
Archive
Scientific Integrity
Publication Ethics Statements
Interviews with Outstanding Authors
Newsroom
Sponsored Conferences
Podcast
Contact
Special Collections
Submit an Article
Online ISSN: 1945-4589
Research Paper
|
Volume 15, Issue 4
|
pp. 1158–1176
Comprehensive landscape of immune-based classifier related to early diagnosis and macrophage M1 in spinal cord injury
Back to article
Figure 6
(6 of 11)
−
100%
+
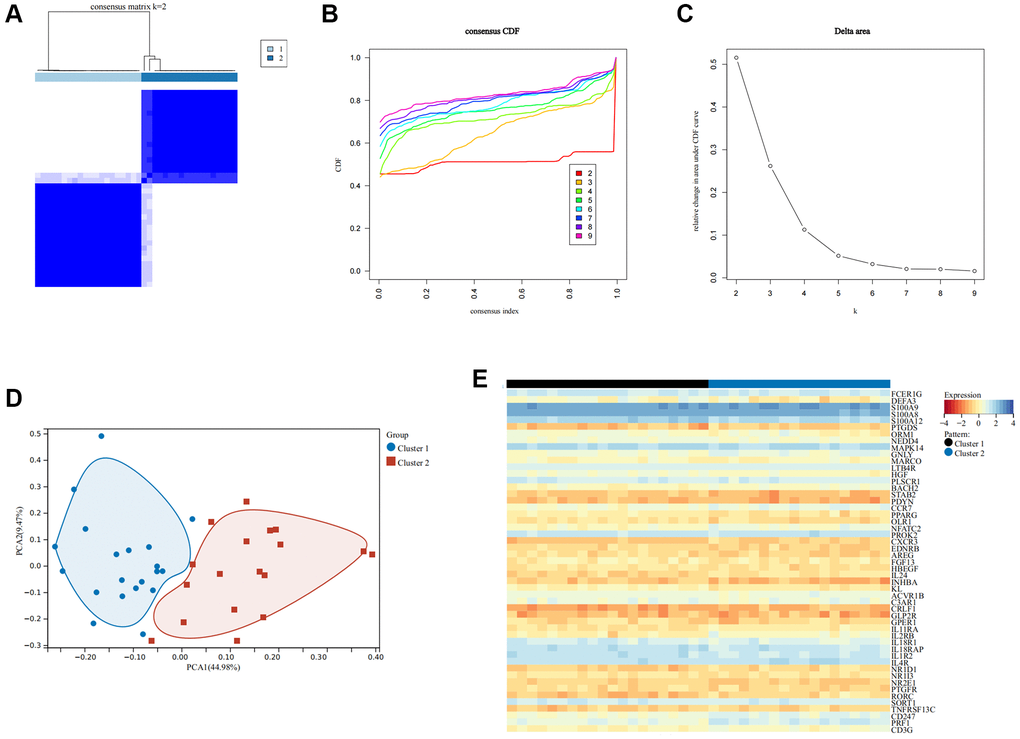
Figure 6.
Recognition of immune modulation patterns in SCI.
(
A
–
C
) Clustering matrix plot at k = 2 via unsupervised clustering analysis; (
D
) PCA analysis of immune modulation patterns; (
E
) Heat map showing the expression of important IRGs.