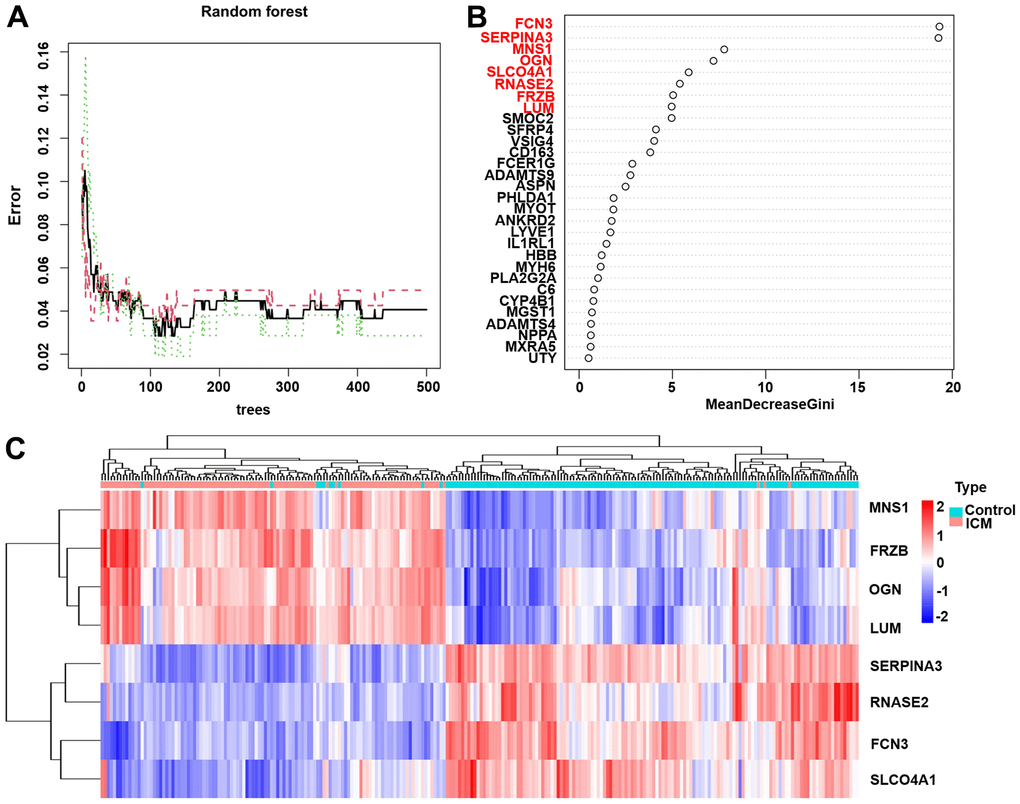
Figure 4.The results of the top 8 DEGs screened by random forest. (A) The plot of performance in log scale against epoch number. (B) The importance of the top 8 DEGs ranked by the mean decrease in accuracy. (C) Heatmap of the top 8 genes. Red blocks indicate high-expression genes, and blue blocks indicate low-expression genes.