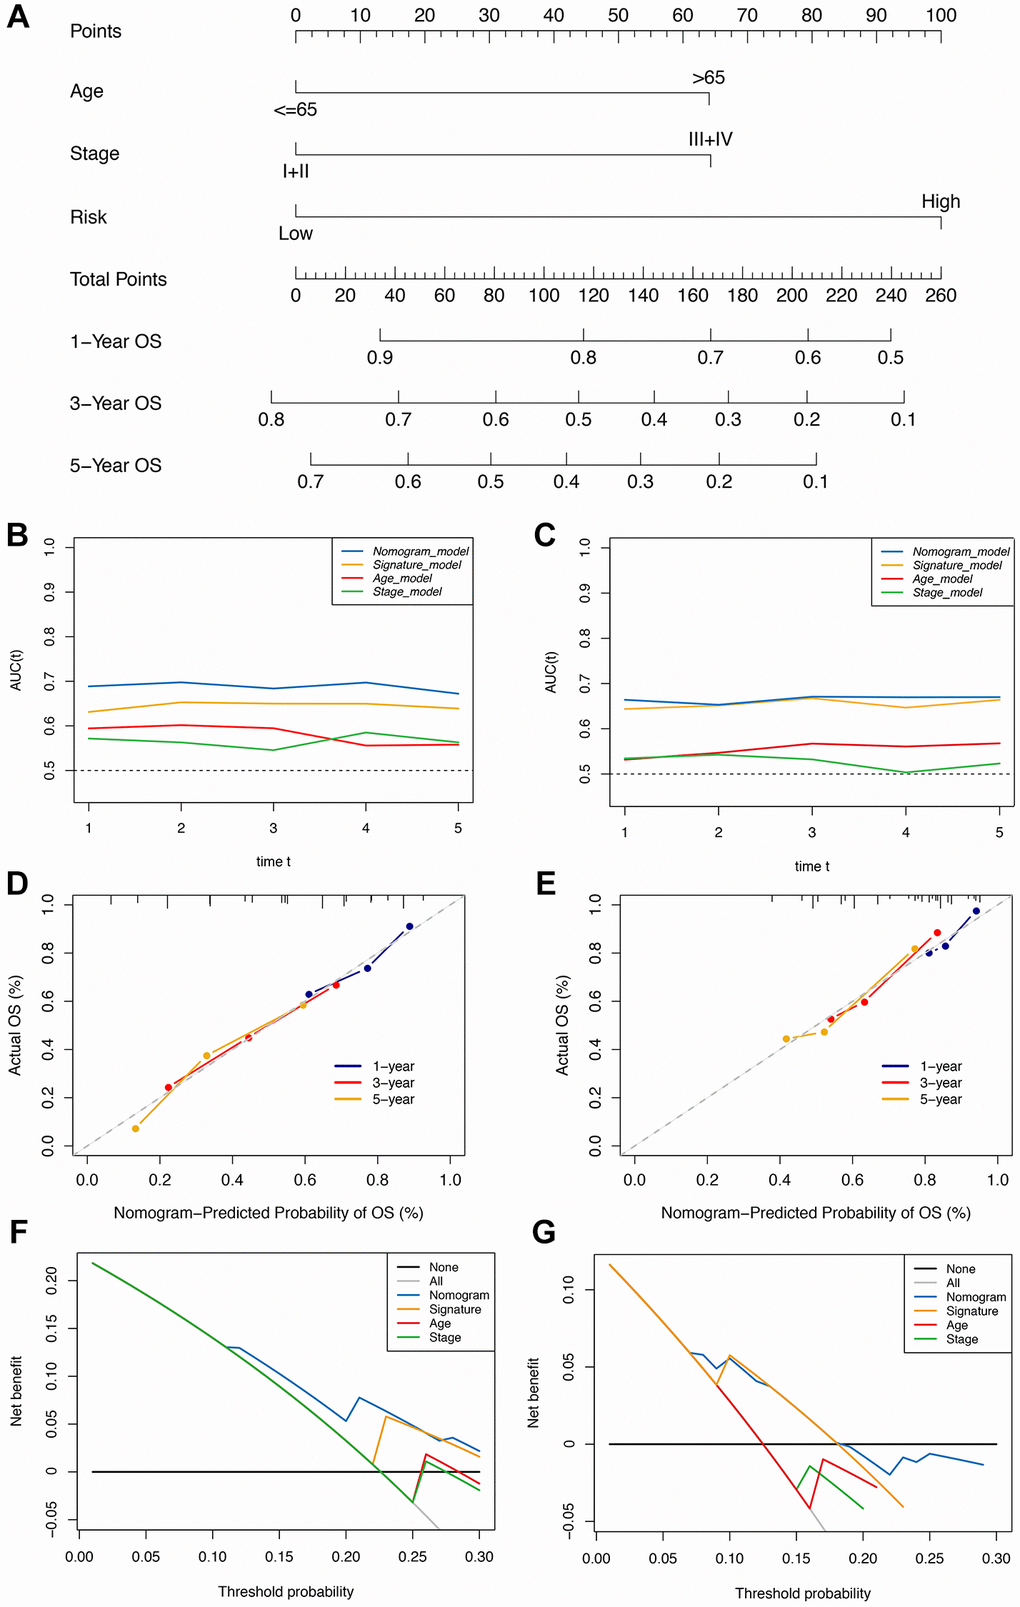
Figure 4.Construction of the immune-clinical nomogram. (A) The nomogram for predicting 1-year, 3-year, and 5-year OS for GC patients. (B, C) Time-dependent ROC curves for the nomogram, immune signature, age, and stage models at different time points in the TCGA and GEO datasets. (D, E) Calibration curves of observed and predicted probabilities for the nomogram in the TCGA and GEO datasets. (F, G) DCA curves for the nomogram in the TCGA and GEO datasets.